
 For the last decade (#omg!), I’ve consistently complained about a fundamental flaw in Web Analytics tools: They incentivize one night stands, rather than engagements matching customer-intent.
This leads to owners of digital experiences (insanely) expecting all visitors to their websites to convert right away – anything less than that is a failure. Damn the intent the customer is expressing.
[Sidebar] I’m experimenting with sharing short stories via an insightful newsletter. I’d love for you to sign up: The Marketing Analytics Intersect. Thanks! [/Sidebar]
It also results in Marketers obsess about awful things like last-click conversions (die last-click attribution die!). They make silly user experience decisions (Searching for car insurance options? We will remove every single thing from the page except a GET QUOTE button. Ha! Sucks to be you Visitor!). They never consider Think or Care intent, all they obsess about is Do intent (See-Think-Do-Care business framework). Not even all of the Do, just the strongest of commercial intent. The very bottom of the Do! It really is quite crazy.
You’ll agree all of this sounds quite insane. Not just insane, so visibly insane that everyone should see through it and fix their minds/reports/strategies. So, why are we still so obviously wrong and still on the insane path?
Simple. It is just how all of the Digital Analytics tools are configured at their very core.
Every standard report in every standard tool is configured off Visits (or in Google Analytics language, Sessions), rather than Visitors (GA language, Users). The specific metric I’ve been mad about since day one of this blog (May 14th, 2006!) is Conversion Rate. It is measured as Orders/Visits. [Or, its variation Outcomes/Sessions]
Built into that is the mental model that if you visit a website, then every Visit has to result in money for the site owner. Else, it is a failed visit. Scroll up a bit, see that formula again.
This is especially true for an ecommerce website, but it also applies to non-ecommerce websites like this blog, Occam’s Razor, that uses Macro and Micro Outcomes to compute Economic Value.
Every visit is not an opportunity to jump into bed with the visitor. Don’t be that person. Say hello first. Introduce yourself. Buy them dinner. Get to know them. See if you are a fit. Help people make decisions they want to make. If they are expressing Think intent, deliver that content/answers. If they are expressing Do intent, help them figure out the best, most fit, solution for them. If they want to think about it, give them time. If they want to ask their wife/boss (often the same person :)), give them a convenient way to do that. So on, and so forth. Basic humanity stuff.
If you want to give your organization, your people, the incentive to move away from one night stands to digital engagements that keep pace with our customers and are driven by their intent, you need to make one simple change.
The Conversion Rate formula should be: Orders/Visitors. [Or, it’s variation Outcomes/Users]
So simple.
Every single visit by every single visitor is no longer judged as a success or a failure at the end of 29 min (max) session in your analytics tool. Every visit is not a “last-visit”, rather it becomes a continuous experience leading to a win-win outcome. Every marketer now has an incentive to focus on the person (visitor, user) rather than a visit (session). This leads to more savvy thinking, like not really caring what the current referrer/source of the visit is, rather obsess about the multiple marketing touch-points leading up to this visit. This forces designers from the awfulness of GET QUOTE, BUY TICKET, and other insane giant red buttons, to Get Quote and another button that says “Identify Best Fit”. Or, pairing up Buy Ticket to “Save Research.” It brings such deeper care about the customer experience across visits (and then, across devices!).
Outcomes divided by Users.
Shifting the focus to solving for a relationship and giving up on constantly scoring one night stands.
It is something small, and yet something so big. Metrics create incentives, bad metrics create bad incentives. It does drive me bananas that until today IBM, Google, Adobe, and every other major analytics tool still runs off visits, incentivizing bad behavior (sadly, quietly without executives even realizing it most of the time).
While this is a great lesson in the power of defining metrics optimally, why bring this up, one more time, today?
Because now, you don’t have to pull data out of your analytics tool’s API and do your own calculations with the right formula. You can do it directly inside Google Analytics!!

I love the wonderful decision of the Google Analytics team to give us all control over how we want to see our metrics calculated. An additional benefit is that the team does not have to be create everything for it’s users, because it is very difficult for them to understand the needs of all users. Like with the glorious custom reports feature, we can now go in and create the exact view we need.
In this post, let me share how to use this wonderful feature by highlighting a handful of my favourite calculated metrics (staring with my new BFF, people centric Conversion Rate!).
Here is a run-down of the main sections of the post… I recommend reading them in order as I tried to solve for the best learning experience…
#1. Real Conversion Rate Per User
#2. “Gross” Calculated Profit
#3. Average Time Per User
#4. Combine Results / Metrics Performance
#5. Product Views Per Transaction
Closing Thoughts.
I hope you are really excited about what you are going to learn. I am so very excited about this feature, and the cultural shifts in your organization’s thinking that you will drive – not just the new data you’ll provide them with.
Here we go…
How To Use The Google Analytics Calculated Metrics Feature
The GA team has a wonderful Calculated Metrics User Guide you can read. All in all, a very simple, well designed feature. Here, quickly, are the main bits…

Give the metric a Name. Ignore External Name. You’ll have five choices for Formatting Type (Integer, Currency, Time, Float, Percentage). They mean the obvious things, we’ll try and use each of them below so you’ll know what they are doing. Finally, the magical part, type in the formula.
Marvelously the GA team has made this brain dead easy. Start typing the name of the metric you want, then type in the operator (plus, minus, etc.), and then type in the other metric. Done! You don’t need to know all the technical database definitions, just type in the human understood name. You don’t even need to worry about the parenthesis etc!
Finally, hit Create.
Go get a Red Bull. You deserve it!
Now, let’s look at some of the calculated metrics I find most useful in my day-to-day work as an Analyst.
#1. Real Conversion Rate Per User
This is the baby that started it all! It is a very simple metric to create, it will have a powerful impact on how your company thinks of success. Up and down the chain of command.
It is extremely easy to set up…

Two things to note. I’m using the Formatting Type Percent, as we are going to express the result in percentage terms. Since I’m not using an ecommerce website in this example, I’ve typed in Goal Conversions in the Formula field. If the above was for an ecommerce website, I would use {{Transactions}} / {{Users}}.
Save your work.
Now what? Here’s where things get a bit tricky, for sensible reasons.
In order to see your new and gorgeous calculated metric, you have to create a custom report. [How to: Custom Reports] It is quite easy, here’s a very simple one for conversion rates…
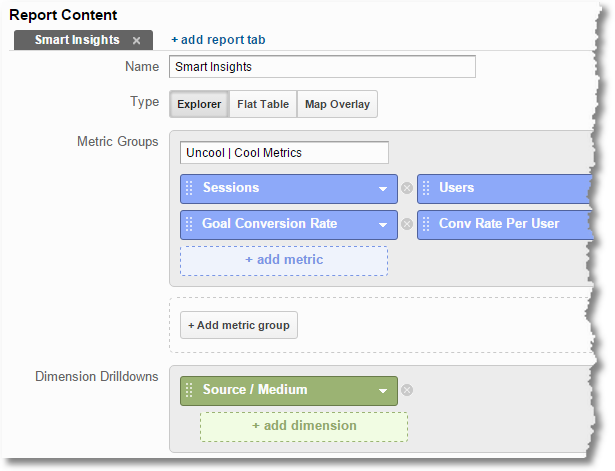
For the purpose of demonstration, I’ve chosen both Sessions (also referred to as Visits sometimes), Users (also referred to as Visitors), the Conversion Rate as GA would show by default (the one night stand version), and the new calculated metric (Conv. Rate Per User).
Let’s look at these metrics by the simplest dimension you can possibly use, Source/Medium.
Here’s the resulting report…

First thing you’ll notice, is that your Conversion Rate Per User is higher than the inferior one. This is simply because not everyone converts on the first visit (#doh). The important bit is that this shift in metric definition will help drive all of the benefits mentioned at the top of the post.
Also notice that the increase is not even, it is +10 percentage points for RSS, but only +4 percentage points for Yahoo!. This will encourage you to understand each cluster of users, and their intent, much more cleverly.
Fun, right? Let’s keep going.
I worry at this point that you’ll think complaining is the undercurrent in this post. But. I can’t help it.
It has always upset me that we measure success using the metric Revenue. Make not mistake, Revenue is fabulous. But, Revenue by itself does not determine success.
Here’s a simple example. You spent $211 on your AdWords campaign cost for keyword Calico Critters. The resulting Revenue was $958. Success? A profitable transaction?
Maybe, maybe not.
At the very minimum, two things are missing. First, the cost of goods sold (how much did the product or service cost you) and associated human costs (you, the company managers, clerks, CEO et. al.). Again, at the minimum Profit = (Revenue) – (Campaign Cost + COGS + Humanity).
While you can’t get down to an accounting system level precision in Google Analytics, you can be smarter about if you are making money. Here’s the calculated metric for one of my ecommerce sites…
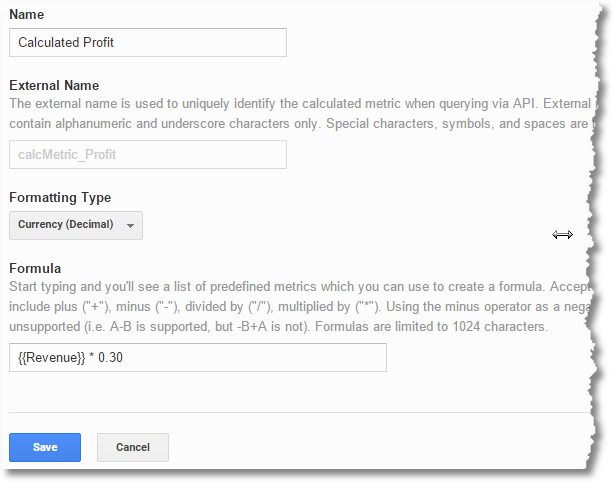
Again, two things to note. I’m using the Formatting Type: Currency (Decimal). In case of this business my COGS plus Human Cost is approximately 70%. Hence, the formula for my Calculated Profit is as you see above. This is not perfect (it certainly won’t be the same for every product I sell), but I’m in a much, much, much better position using a swag for gross margin.
As in the case above, I’ll create a custom report in order to see my results. Here’s that report…

The last column is my new calculated metric.
Now look at the numbers again. I spent $211 making an approximate profit of $287. My net profit is $76.
Here’s the quick benefit for your Marketers and Senior Decision Makers from this exercise. At least they won’t do this math: $958 – $211 = $747. Hurray! We are making tons of money!!
At least they’ll be closer to reality, it’s not $747, it’s $76.
The campaign is still in black. But you’ll discover with this calculated metric that that might not always be the case. You’ll also be forced to have the opportunity cost discussions. Maybe that effort in a different area could have yielded more than $76. Oh, oh, oh, and what if for this campaign you were giving a 15% discount via coupons? We did not account for that in our COGS and HC. Did that 15% coupon just wipe out your $76, or worse lose money?
These are questions that Digital Analysts rarely get involved in. Because they are limited to Revenue. In this case, it is not a limitation of the tools we have. But, you can now ensure that your company is not one of those silly ones that does not get closer to understanding profitability of their digital efforts.
Not quite as revolutionary as #1, but I guarantee you that this is going to start very tough discussions inside your company. And, all for the better. I’m ignoring how much more influential you will end up making the Digital Analyst inside your company.
Smart power, of smart metrics. Calculated metrics!
Let’s say we are running a content website like my beloved New Yorker. [You want your mind blown? The Gene Hackers.]
We care of our Pageviews, our Sessions, and on bright sunny days we care for Time on Site (also called, Average Session Duration).
But, these are session based metrics. I.E. they only tell us what is happening during one visit. That is nice. But, what’s marvelous is understanding the time people are spending across all their visits during a given time period.
Shifting from, how much time did Avinash spend during his 17th visit to our website to how much time did Avinash spend in January on our website?
While can’t quite get to the Avinash part (at least without using User-ID Override in Universal Analytics), you can get a sense for the average user on your website.
Here’s the calculated metric…

We are using the Formatting Type: Time. That’s what we are going to express the output in.
We take the Session Duration metric in GA, and flip to focusing on people rather than the visit by dividing by Users.
Quick relevant custom report, and you are in business.
The shift we accomplish here is to move attention away from a transient pageview based world, one where silly, short-term, often lowest common denominator decisions permeate, to looking at what creates loyalty. What sources. What content. What cities. And, so much more.
As in the case of Real Conversion Rate, this calculated metric benefits from a pivot to people. There are many other metrics you can do this with, I’ll let you explore them at your leisure.
#4. Combine Results / Metrics Performance
This lovely use of calculated metrics eases the burden quite often.
Here’s a simple example, one that was painful for me.
On the right navigation of this blog you’ll notice that I proudly display my best selling books Web Analytics: An Hour A Day and Web Analytics 2.0. You should buy them, 100% of my proceeds from both books are donated to charity (thanks to you, roughly $300k thus far!).
As you might imagine, I track the clicks and conversion on all the outbound links including those of the books. The challenge is that I get them reported separately…

I don’t want to see the books reported separately. I ten goals. I don’t have time! :)
[Ignore the fact that Goal 9 was broken for a while, the cobbler’s son not having shoes. Or, that Goal 10 is now broken. I need help cleaning up my Google Analytics implementation. Ironic!]
Well, now I don’t have to worry about this problem. Using calculated metrics, I can fix this problem easily…

We are using Formatting Type: Integer. Makes sense.
You don’t have to type in all that stuff you see in the Formula field. In my case, I just started typing the name of the book and GA does the rest for me. Brilliant.
Here’s the complete formula: {{Web Analytics 2.0 (Goal 8 Completions)}} + {{Web Analytics Hour (Goal 9 Completions)}}.
I now have my lovely Calculated Metric of Total Book Clicks to add to any custom report that I want…

There are so many scenarios where you can apply this simple, but effective, strategy to make your life a little easier (and reduce your reliance on post processing in Microsoft Excel).
I’m using addition in this case, you can of course use division, multiplication, subtraction and even more craziness. Play with it, just make sure you don’t end up with the crapification called Compound Metrics (lesson two: social media compound metrics).
#5. Product Views Per Transaction
I’m going to expose how very old I am. I used to use NetInsight. How many of you still remember it? It was a nice tool.
As I was trying to think of new calculated metrics to play with, I thought of a metric that I used to like. Product Views Per Session. How many of views there are on average of your product pages (the thing that hopefully makes you money), during each visit. It was quite cool.
So, here’s a metric that is jut as cool. How many product detail pages do people see per transaction that occurs on your website? Product Views Per Transaction…

We use Formatting Type: Float.
The metric begins to help you understand how many products people are comparing, looking at, when they do business with you. Is it a lot? Is it a little? Your UX/UI teams might be quite interested in it.
Of course, you can also do Product Views Per Session. Just change Transactions above to Sessions.
The one gigantic caveat for this calculated metric is that you have to have implemented Enhanced Ecommerce on your website. It is totally, totally worth it for a million other reasons (very smart new metrics, reports, all around sexy fun), but this should give you one more reason.
If you are a user of the standard edition of Google Analytics, at the moment you can only create five calculated metrics. If you have the premium edition, you get 50.
The five ideas above simply scratch the surface of what’s possible with calculated metrics in Google Analytics. I have so many, many more I could share with you. I love being able to compute Cost Per Acquisition (a metric I’ve so wished for in GA). I can convert so many more views to be based on a person, Events and Internal Searches and more. OMG, and it is so much fun to do simple Currency Conversions. I can also sessionize any metric that GA won’t sessionize by default.
I hope you’ll truly explore all that you can do. It is a lot. And, with every little success you’ll end up with just the beautiful metrics you need (ideally in focused custom reports, trust me a datagasmic outcome!).
I can’t resist, one more idea. I even have my very own custom dashboard for my Sr. Executives comprised entirely of Calculated Metrics! It is so cool. But, something for another day.
Calculated metrics are about solving computation problems, but, I hope you’ll see in every case above, at the end of the day, it really is about changing the culture of your company by having data create better incentives.
As always, it is your turn now.
Which one of the the above five calculated metrics do you love the most? Have you created some of your own, if so would you please share your most useful? Are there clever formulas you’ve created beyond simplistic one in #4 above? What would you like to do with Calculated Metrics that you are unable to do at the moment?
Please share your clever examples, brilliant ideas, insightful critique and valuable feedback via the comment form below.
Thank you.















73 thoughts on “Excellent Analytics Tip #27: Chase Smart Calculated Metrics!”
We can consistently count on you to make the complex simple Avinash. What’s remarkable is that you can make the simple even simpler. Though our team is using Calculated Metrics, after reading this article I fell like I really understand all the power.
We are also relying on Pageviews Per Session and repeated event interactions by calculating Total Events/Unique Events.
Hi Avinash,
For Publisher websites (running AdSense), they could calculate AdSense Revenue Per User:
{{AdSense Revenue}} / {{Users}}
This would help publishers find the most profitable traffic that visits their website.
Adil: This is a very good idea! It helps create a cluster of users who we can reliably count on to help us earn AdSense Revenue.
If we can somehow figure out how to use it for experiments across sessions (most experiments are session based), we can even figure out if reducing the number or type of AdSense ads this cohort sees causes a higher revenue number for us.
Thanks for sharing this.
Avinash.
You’re right that analytics should be less focused on single sessions. However, there are serious problems with the Users metric that stop it from being a better choice:
Users are totaled incorrectly in downloaded or unsampled reports.
The Users metric forces sampling over even a moderate period of time.
The calculation is opaque; the page https://support.google.com/analytics/answer/2992042 doesn’t actually explain how the calculation works, just that there are two different methods that could be employed. It also refers to something called “client-side time”, an expression not appearing anywhere else in Google Help (https://support.google.com/search?q=%22client-side+time%22).
One person can be multiple users if they browse on several browsers, across several devices. I daily use both Chrome and Safari (and sometimes IE, when I’m in a tight corner) across a total of five devices, often in incognito mode. I also clear cookies occasionally.
Goals are based on Sessions, so each user can complete a goal as many times as they like. Without uniqueness of goals, the percentage of goals per user makes little statistical sense.
There’s an attribution problem(!) in reports such as Default Channel Grouping when you use Users. One user can be be included in multiple categories, leading to percentages that don’t add to 100. This could be solved messily by reassigning attribution and not using integers (for example, if a user has arrived by Paid and Organic, assign 0.5 to both) but it fundamentally boils down to the fact that most metrics were designed to be used with Sessions, and if we’re to change our thinking to be user-based then we need to change the basic metrics too.
Session based metrics are simple and intuitive; each session has beginning and end points, and definable activity in the middle. This means that it’s easy for analysts to create metrics based around them, and there are a host of sensible and intuitive metrics already built in that make sense with Sessions. Users, on the other hand, are fluffy and unclear. Creating our own user-based metrics may seem easy, but there’s a reason why there aren’t any pre-defined user-based metrics! They’re actually a tin of worms that we’re not equipped to deal with.
John: I do appreciate your feedback very much. Some points you make are more valid than others, but they are things we absolutely should consider carefully.
If you’ll indulge me, let me share a metaphor. We want to go from Beijing to Moscow. We currently have a bicycle, and it will definitely get us there. I’m recommending that we use a car, even if it breaks down every 500 miles and needs new tires every 1000 miles. It will lead us to a better outcome, and do so faster than using the bicycle. Your feedback is that an airplane would be the best, and you are right. The problem is that we don’t have any airplanes yet.
And, we do at least have one rock solid way to make the car a lot more reliable. Switch to Universal Analytics and mandate the implementation of User-ID Override and massage the egos in Marketing to create incentives for your users to log-in. Now, your car breaks down every 2000 miles and needs new tires every 5000 miles. Not perfect, but now even more desirable than the bicycle.
-Avinash.
Hi Avinash; thank you for getting back to me.
I appreciate your metaphor, and you’re right that we should be looking to make the best out of what we have. However, I feel that what you’re suggesting is really an electric car, and my point is that the infrastructure is all set up for something very similar but fundamentally not the same, and the differences will lead to us having some real trouble getting through Mongolia and Kazakhstan. If there were just a little more infrastructure in place, such as the ability to make goals unique across a user rather than a Session, then we might make it the whole way there without having to desperately search for a plug socket and adapter.
Thanks,
John
I think measuring unique conversions per user is more necessary for some users than for others. If you generate more leads from the same user, it arguably adds no extra value.
If someone buys from you twice, the value is definitely increased, so you don’t need the uniqueness.
Better still (if you can), you could instead use revenue per user as a metric – this has an easy to grasp intuitive meaning – you’re accumulating value over a number of sessions. So you don’t need to worry about uniqueness, or interpreting the conversion rates, and as a bonus you’re weighting to the more valuable purchases, which is more nuanced than number of conversions.
Obviously this isn’t an option for all websites, but you might be able to use a meaningful goal value instead.
It’s great to see that GA is embracing customer centricity. As every digital marketing channel becomes personalized it will be absolutely critical to dimensionalize performance data at a consumer level. This also creates huge opportunity to understand the consumers behind the actions for testing and optimization.
As this feature moves through iterations it would be awesome for Google to add in an API or PMML support as a way to let analysts/data scientists move their models from their laptops to GA for on demand business access.
As a side note for anyone using this feature I’d highly recommend Jim Novo’s book Drilling Down as a primer for customer level analytics.
Ken: Let me join you in also recommending Jim Novo’s excellent book! Link: https://www.jimnovo.com
There is some level of capability using the Measurement Protocol to send data into Google Analytics. But, it is not quite to the level that you’ve shared. Hopefully soon! :)
Avinash.
Just wrote a blog post on calculated metrics for lead generation firms. Hope it makes sense!
nusparkmarketing.com/2016/01/google-analytics-calculated-metrics-for-lead-generation-websites/
We created the user conversion rate calculated metric (transactions / users) for all of our tourism clients’ google analytics accounts because it’s particularly a more true metric for the tour booking industry.
People check out a tour when they go on vacation 2-4 times before they actually book, so we use this metric to get a more accurate picture of true conversion rate based on users, not on sessions.
I’m glad to see experts like you affirming this!
Avinash,
I really like the shift to measuring the interactions in the long term relationship with users. Our website tries to inform users that are considering purchasing products that are over $10,000 or $20,000. They take their time gathering information as they move towards making decisions. Often, this occurs over months of time. Having a customer-centric focus is vital to understanding them and where they are in their decision-making journey. For this reason, I really like Real Conversion Rate Per user, Average Time Per User and Product Views Per Transaction. The theory is that as user narrow down their choices and start to become more committed, they are spending less time on the site browsing and are viewing fewer product pages….just the ones that they are highly interested in.
A couple of quick side notes..
I have experimented with calculated metrics a little bit in GA Premium. I chose a formatting type of ‘Float’ because the value of my calculated metric was rather small. As a result, all values in my GA custom report appeared as <0.01, which wasn't very meaningful. The trendline in the chart seemed accurate and helpful. It would be a great enhancement if Google could extend the number of decimal points that can appear in custom reports by a couple of additional places.
Also, I really think calculated metrics are critical to helping us report on what truly matters to our client's businesses. This makes me want to create GA Intelligence Alerts to help monitor those key calculated metrics. That functionality doesn't appear to be there yet. I would really like to see Google add that.
Happy 2016, Avinash!
Just a quick though re: your metrics showing up as <0.01… If you add a condition to multiply the metric by 100, does that even-out the problem of the numbers being too small?
I've not experimented with this but I'm wondering if it might clean up your numbers a little bit?
Hi Avinash,
For #2. “Gross” Calculated Profit, I am curious as to why you would not take the calculation one step further and subtract ‘Cost’ from the Calculated Profit equation?
Why not make it: {{Revenue}} * 0.3 – {{Cost}}
This way it may get rid of any confusion with whether or not ‘Cost’ is already factored in and brings us as close to the “true” profit as we can get with our estimations and calculations. This also eliminates an extra step in having to perform another calculation to get down to the profit.
Kevin: A most excellent suggestion, and one that I have implemented on accounts where we are passing in all the costs (for Display, Bing, Email, Facebook and other campaigns).
In accounts where they are not sending cost data into Google Analytics yet, I like doing it the way it is in this post because I want the Cost column for those channels to show Zero. That why they’ll remember they still need to take Cost out of the Calculated Profit number.
If I use the formula as you suggest (which, let me repeat, is an excellent suggestion) I worry they’ll make those campaigns look better and the business leaders won’t know the cost is missing.
Avinash.
We have a holiday business in the UK and likewise people visit the site a number of times before making a purchase so up until now we use download a brochure as a goal rather than make a purchase as that usually necessitates a number of visits.
This post will allow me to refine the analytics to suit our business.
Thanks!
Speaking of conversion rates, I run an eCommerce company for which I configure the conversion rate as “# of transactions / # of sessions that did not start on a blog page”.
I do this because I like to exclude sessions in which a visitor stopped by for the purpose of entertainment (reading our blog) and NOT for shopping. I’m assuming that if the first page visited is a blog page the visitor’s intent was entertainment.
Kevin: Once we have the base agreed on, I focus on Users and not Sessions though, I do think that you can further refine what you focus on in terms of “convertible users”. In your case you are excluding blog readers.
My “Excellent Analytics Tip #8” was on this very topic. It was called: Measure the Real Conversion Rate & “Opportunity Pie”
It was written on Nov 13, 2006, but you’ll see your idea in it! (And, a couple more.)
Avinash.
Avinash and Kevin,
When I ran an ecommerce business, the conversion rate i focused on was what i called back then net unique visitors. I took my visitor count and subtracted the number of bounced sessions to get at the number of visitors who hung around for more than a page, ie, the maximum number of potential conversions i had for that time period.
My bounce rate was fairly stable so this way i felt i had a better handle on how my conversion optimization efforts were doing.
I think that’s a fair thing to do.
However, what do you do for cases where the session started on a blog page and ended in a sale? Do you just not count those?
Todd: There will always be variations of what is expected to happen. We simply apply some simple logic and thinking.
For example, if in my case loads of people who start on the blog and convert…. I’ll definitely include that traffic because it turns out it has a lot of Do intent rather than the expected See or Care intent. (See: https://zqi.me/seethinkdo)
If it turns out that it happens in a minority of the cases, ignore it. Not a big deal.
If it is somewhere in the middle, you are the boss, you get to decide!
Mental flexibility, the Analysis Ninjas BFF. :)
Avinash.
I have done analytics consultancy since 5 on a full time daily basis. I strongly believe in user centered analytics. I even believe that it is the solution for the endless discussion about channel attribution, which is totally nonsense. You need to invest into target groups, not into channels. Therefore, you only want to look into budgeting of user groups. User centric, multichannel, everything comes together fluidly and easily if you deny session-bases measurements.
The concept is clear and analytics-geeks like ourselves understand it. I once tried to roll it out for a client using google analytics. It was a mess. As long as the tool mixes session-KPI it is not possible to successfully integrate a custom centric dashboard and thinking. Think about bounce rate, we all love it. It’s a session metric. We need to get rid of it, it is time.
At the end, I had full of calculated complicated metrics, I realised google analytics is still not there. So i dropped the project and rolled back to session-based analytics. But i wont accept to give up. Look at webtrekk-tool here in Germay, they offer a huge custom centric system since late 2015. the software developers know where it is going. But to fit into market they have something between both worlds, but thats confusing more as helping, especially clients.
Arne: I’m optimistic that all web analytics platforms will continue to evolve to be person-centric at the core. Mobile is only accelerating this evolution.
Meanwhile, we need to do a lot of work at our end (hence Universal Analytics), and we might have to have “bridge scenarios” (not in the perfect world, by on a bridge from current terrible one to the perfect one).
Avinash.
#5. Product Views Per Transaction—
I cannot to implement this for the eCommerce company I work for Avinash!
Been looking for more ways to delve deeper and gather insight on our customers because in our marketplace, visitors generate 80-90% of total sales within their first visit, so we need to ensure there is no friction between landing on the first page and completing a checkout, especially with PPC traffic because it’s expensive.
I bought Web Analytics 2.0 and Web Analytics: An Hour a Day about a month ago and am slowly but surely making progress through your first book. It’s interesting to discover the history of web analytics…and to think, we are still in the infancy stages. I can’t even imagine the tracking of the future.
Thank you and keep up the wonderful work my friend :-)
Great post!
In the past I’ve definitely been guilty of not fully using Google Analytics’ full capabilities, these tips can really help avoid that.
I’m off to create my first calculated metrics.
Avinash: This is a very helpful addition to the Google Analytics arsenal.
At our agency, we’ve created a bank of 30 or so calculated metrics that we have categorized by business type. When we take on a new client we immediately create the five or so metrics that are most relevant for them and add them to a custom report. This becomes the central hub of what our clients use, rather than using the standard reports. It simplifies GA for them quite a bit.
We are going to add all five of your suggestions to our bank of 30, thank you.
Nice blog, Avinash. I am also very enthusiastic about this new function. Below my additions:
1. Cost per visitor (without bounces) > cost/(users-bounces)
2. % visitors that navigate inside your site > Unique pageviews-entrances/ unique pageviews
3. Total conversion value per content group/page.
Do you know how you could calculate total conversion value per content group/page? Page value * unique pageviews is not possible.
4. Value per user > goal value/users
5. Shopping cart conversion > transactions/add-to-carts
Gerard: I love these new ideas, thank you for sharing them!
I’d not thought of the first one, it is lovely.
For the second, if you are only using pageviews (for uniques and entrances), can it be a Visitors metric? Would the visitors metric just be bounce rate (% of visitors that navigate inside the site)?
The third is also interesting, I’ll check if you can roll up Page Value (a better metric) by Content Grouping.
The fourth might be similar to Per Visit Goal Value, though very interesting to group it at a User level across sessions.
The fifth is a really nice way to have everyone have this metric. In Enhanced Ecommerce there is a metric called Cart Abandonment (and another called Check-out Abandonment) that solves the same issue. But, now thanks to your idea everyone can have it!
Thank you so much.
Avinash.
The second calculated metric is the reverse of entrances/unique pageviews.
For the third idea I want to calculate pagevalue*unique pageviews. I hope that you can help me out with this calculated metric.
I did not know about cart/check-out abondenment metric. Could you use this metric in every custom report with Enhanced E-commerce feature?
You can create ‘Page Revenue’ metric (Page Value * Unique Pageviews) by Google data studio.
Hi Avinash,
First of all Happy new year to you and your family. I hope this year will bring lots of happiness and most importantly better health.
My question is as we seen actual profit in ” Gross” calculated profit is $76 rather than $747, can we add one more column and use this formula {{calculated profit}} – {{cost}} to make it totally cristal clear what is the actual profit rather than guessing and doing it manually, as you taught us to get the result by just looking at it. Is it make any sense ?
Can I ask one question that is not related to this post but is important one ? As we are starting a new online retail business, we came across a very confusing problem and I think lots of first time entrepreneurs in online retail has this problem. I tried to find about it on your blog and also tried to find it by adding avinsh kaushik on Google but I didn’t get any answer.
If you like , I can share this problem in the next comment.
Hope you have a great day .
With Regards,
Bhola Prasad
Bhola: At the moment, you are unable to use a calculated metric as a part of a formula to create a new calculated metric.
Though, you can incorporate Cost, as we discussed in a different comment, into the original calculated metric. It is quite easy.
Why don’t you email me your question, I’ll do my best to answer.
All the best!
Avinash.
Hey Avinash,
First of all, thanks for the informative post.
Was curious as to how to integrate a referral spam filter into these metrics? We’ve made it into a custom segment.
Would be nice to calculate these metrics using these segments with real visits, or at least minus a ton of ghost spam…
Alex: Starting Oct 2015, you should have seen a huge drop in the frustrating issue of referral spam (and it should also get cleaned up for your historical data). So this is not something to worry about as much (except for very small and ignorable noise).
If you are still seeing this issue beyond ignorable noise, I encourage you to work with a GACP (www.bit.ly/gaac), they can both see what is going on and escalate it to the right folks.
Avinash.
After 9 years, I’m still extremely grateful for the insight you share in these posts, Avinash. I just want to chime in with a question and what I think is an implication of the analytical techniques on which you enlighten us with this blog: Many large companies are configured to make these techniques political issues. You’ve commented on the importance of org configuration in other posts and your books, so I’m certain this isn’t news to you. For others, however:
I only have experience at 3 large corporations so far, but in all three, the organization was divided by function rather than by product. And the marcom function is always divided by channel rather than by goal. I have a colleague in charge of social media, a colleague in charge of e-mail, a colleague in charge of display ads, a colleague in charge of search and a colleague in charge of video ads. This means that, when analyzing channels for opportunity cost inspires a “cut” decision, somebody gets fired (or in the wiser of these organizations, reassigned).
The org tension caused by such decisions is presumably more detrimental than the decisions are beneficial, so these organizations tend to shy away from measuring profit so directly altogether.
It’s a shame. But, it’s helped me learn that, when I start a business one day, I’ll hire my marcom people for goals rather than for channel. Maybe a transactional ad specialist, an awareness/knowledge specialist, and an emotional engagement specialist. Or a top-funnel specialist, a mid-funnel specialist and a down-funnel specialist.
Now for the question: Do you have any insight you can share about marketing teams who were configured for goal rather than channel? Could that configuration be beneficial? Or is there a good reason we usually divide our teams by channel?
Ryan: In very large companies, it is the size and the org complexity that yields such sub-optimal outcomes. Each group is solving for a silo, and no on is solving for the whole. While this sounds terrible to say, it is very hard to avoid in a big company because of how fiefdoms naturally arise.
The optimal strategy is to have a single digital czar who is responsible for all things digital, all, reporting to the CMO of the company. All other functions organized underneath this digital czar. This has a great opportunity to benefit digital as a whole, but also solve for an overall goal with macro business multi-channel priorities.
Avinash.
Great post!
For #2. “Gross” Calculated Profit…
Could you build on that and make a net profit column? Like a calculated metric that is based on a previous calculated metric?
Matt: You can definitely do something like this:
( {{Revenue}} * 0.30 ) – ( {{Cost}} )
This way you get to the end number more easily.
At the moment, you can’t use calculated metrics inside calculated metrics. :)
-Avinash.
Great post! I’m finally getting the hang of how to make the most out of google analytics thanks to your tips.
I’ve implemented your recommendations as the starting point for all my clients.
Hello!
Great article, as always!
Do you know if we can do that using Google Tag Manager?
Because we are limited to 5 variables with GA.
Thank you again!
Bastien
Bastien: Google Tag Manager does not have anything to do with Calculated Metrics. You’ll find this feature in the Admin section of your account.
GTM is a fantastic product, you can use it for loads of other things of course: https://www.google.com/analytics/tag-manager/features/
Avinash.
So I’m guessing we are limited to 5 variables ?
Too bad !
Bastien
Thank you for this awesome article Avinash.
As someone that has background in economy, I really do appreciate taking your time to go through conversion rate and profit. Guys in SEO world often disregard it (which is absurd) while chasing simple positioning.
Hi Avinash,
First off, I am a big fan – I am an analyst for a major airline and just starting reading your book to expand my horizons. Second, thank you for this post.. I have a question that I hoped Calc. Metrics could have helped me with – but maybe it won’t and this is unrelated.
I do not know why Products won’t show REVENUE. Products only show PRODUCT REVENUE, which is calculated as: Quantity / Avg Price, which stinks!
Any type of calculated metric that could help me in this realm? Thanks in advance
Jessica: Are you using Enhanced Ecommerce. It is pretty cool, loads of new features, and includes a Sales Performance metric called Product Revenue (revenue from individual product sales).
Check out a bit more about that here: https://support.google.com/analytics/answer/6014872?hl=en#pp
Avinash.
Avinash this is pure gold!
I’m looking to improve my overal analytics skills and I really appreciate the time and effort you have put into putting this post together. We’re now starting to take on more and more e-commerce clients and I was trying to put an analytics strategy together, now I know how :)
Thanks dude!
Graham: I appreciate the kind words, I’m glad you found the post to be of value.
As you put together analytics strategies together, here is a post you might find to be of value:
~ Digital Marketing and Measurement Model
If you have a well defined Digital Marketing & Measurement Model, a smart analytics strategy comes easy.
Great post like always Avnish. Many thanks! :)
I went through most of comments, and have to agree with some speaking about the drawback such approach may bring. In the hospitality sector, 50% of acquired customers (if not more) do not book rooms directly, instead they do some homework comparing different hotels, deals and even room types. If GA didn’t attribute the user to different source every time user’s source changes then I may go with your approach blindly. However (and unfortunately) it’s not the case.
I’m one die hard fan of user-centric analytics and I find GA’s session based analytics kind of outdated and incompetent for the modern digital era, but we are stuck with it and must make use of whatever we have especially after paying a great amount for the premium version.
I have one question that you may have a convenient answer for, if using calculated metrics to drive user-centric insights may result in vanity metrics, would you still be using them especially for big eCommerce sites that generates dozens of millions in net revenue a year?
Thanks!
Loai: Let me answer the second question first, yes. Dump the vanity metrics. Why be less smart for even one more day? I do appreciate that some people are hooked on them, but this is why we have anti-cessation programs for addictive stuff. :)
I’m sorry I don’t understand the first part completely, or what you might be referencing. I welcome more context/clarity. But. Google Analytics takes into account and records every touch-point and the source. If there is no source, it identifies that as Direct. Then, all these touch-points are reported to you in the Multi-Channel funnel reports. Check it out.
Avinash.
Thank you so much for your reply Avnish.
Can’t agree more on the vanity metrics part of the question and I even started to promote actionable-metrics across the organization, but it’s not easy at all to change the perspective from cool big numbers to tiny small percentages. As for the first unclear part (sorry for that) I was referring to the way GA works when it comes to attributing different resources to the same user, for example using the “Default Channel Grouping” with users based analysis.
Anyway, I went back to GA help docs as well as other resources including Simo Ahava’s blog and thanks to you I guess I have a better idea or answer. It’s not about the tool, GA can support user based analysis accurately, but to do that you need to change the way you collect data about your users, and to achieve that (and I quote you here) you need to mandate the implementation of User-ID and enforce users log-in. Perhaps by then finding goals completion per user using calculated metrics could be safer to use :)
Thanks and good day! :)
Avinash, I am not into analytics, but then I have always found your content useful. I first saw you in a Google video – a video course, and since then has been reading your blogs. I have a very silly question. I use Google Analytics, but I have limited knowledge about tracking conversions etc.
Should I start off with Web analytics book? I can commit a lot of time on it.
PS: I just dropped off a comment, not sure if this is the right way to ask question which is not directly related to the post :)
Deepak: Books are really great for structured learning, which is critical early on. If you were considering my books, just read Web Analytics 2.0, and then follow along on this blog.
I would also recommend combining the book with access to a website whose data you can analyze. It does not matter if the site is ecommerce, or non-ecommerce (the book covers both). Practice the lessons as you read them, it is the best way to ensure you are totally getting it.
All the best!
Avinash.
Good Article!
Very clear and informative especially with the pictures and clear explanation combinations.
Hi Avinash
It is great to read your post. This piece of writing is very complex and I was unable to understand this properly.
Is there any video which can explain me these calculated metrics works? It can help a mid valued SEOs like me.
Thanks in advance.
-Abhishek
Abhishek: I’m afraid I don’t have a video on this topic that is public. (If you are a member of http://www.marketmotive.com, you have access to a detailed video with thirteen calculated metrics in it.)
If this feels a bit complex, it can be, my recommendation is to hire a GACP to work with you. They are extremely affordable and will sit with you (sometimes physically in the same location) and through a combination of training and creating actual metrics, help you learn and become self-sufficient.
Here’s a list: http://www.bit.ly/gaac
Avinash.
Thanks for the post Avinash.
I’ve been playing around with some custom metrics but I’m actually having trouble interpreting the data in actionable ways.
It appears that from a data standpoint you can’t overlay these user-level data points, such as conversions per user, with session-level data points, like source/medium or device, and draw any clean conclusions.
Can you give me your thoughts on this?
Andrea: You are right that we can’t mix metrics and dimensions when we apply them to hits, sessions and users. I touched on this topic in this post:
~ Excellent Analytics Tip #23: Align Hits, Sessions, Metrics, Dimensions!
We have to understand how each tool will process the data when we apply Conversions per Users. In GA for example when we apply it to our Channels report, it will look across sessions. For other use cases, do please ping your friendly GACP (www.bit.ly/gaac) or your Account Manager (for GA and Adobe).
Avinash.
Thanks for the reply Avinash. I always like to get confirmation from a proven GA expert.
I understand the dangers of analysis that co-mingles hit and session level data, so I was confused by the co-mingling of session and user-level data in the custom report examples you showed since it stands to reason that it would lead you down a similar dangerous road. However, I am a GACP so I’ll take this question to our boards for further discussion around interpretation, as that appears to be the key here.
Thanks again!
Hello!
Thank you for you work of spreading great idea of tracking right things based!
And also found this in article:
“You’ll have four choices for Formatting Type (Integer, Currency, Time, Float, Percentage).”
In fact here are the five choices not four. I know it does not important but you may like to fix it just to make article even better.
Anton: You are so kind to let me know, thank you!
I’ve fixed this.
Avinash.
Hi Avinash,
Another great post – just in time as I was discussing with a client about Impressions and conversions as metrics for their content marketing. Both metrics aren’t sufficient at all to evaluate the specific content’s quality. We can’t measure other engagement metrics such as shares for this special interest content so we came up with a formula that takes returning visitors (makes sense there) and duration into consideration. Having a certain value here is the same as a conversion and an be attributed with an economic value.
Because reading this content from top to bottom, even in two or three sessions, is very valuable for my client. It was quite a hassle to configure but we are happy with the results so far. Thanks for you input on this – it helped a lot, although the client wasn’t using GA. We could locate a similar functionality now that we knew what to look for.
Cheers,
Pascal
If we don’t measure the most important metrics, it is not possible to analyse how well the content has performed.
By having GA set up we can access a many crucial data, that is of much importance to give a clear idea.
Thanks for the the share Avinash.
Hi Avinash!
Thank you for you work of spreading great idea of tracking right things based!
I have received useful information from reading everyone’s comments.
Hi Avinash, Love this post. Just created all the calculated metrics you suggested in this post in my GA account and gonna use them from now onwards.
Hope you have a great day.
With Regards,
Bhola
Hi Avinash,
I read through your awesome article and though it would be great to use calculated metrics to analyse the actual net profit per product: net profit = net revenue – net equity. Revenue is available via ecommerce in GA. To get equity I used data import for product data.
But now where I implemented my idea I realized that I can’t use calculated metric on product level. :(( I didn’t see the feature where I can set the scope of a calculated metric. Or is this simple not possible?
Have a nice day.
Br, Michaela
Hey Avinash,
Thanks for the awesome post. I’m a huge fan of #2 – Gross Profit. So many ways to improve that number instead of always trying to get more revenue.
I use a bit more complicated method than your example. I upload my COGS data via the Data Import. Sometimes I get wonky data though. :/
https://d.pr/i/bPej
Any thoughts on why the processed COGS data is so off?
It’s a great addition and it gives me the chance to see some stuff more clearly. Unfortunately, it doesn’t give me exactly what I want. For example, let’s say I want to calculate the Conversion Rate of Users. I’ll do something like this: {{Goal Completions}} / {{Users}}
Now, let’s say there are 5 Users and only 1 User of them completed the Goal 10 times in a specific period of time. The “Conversion Rate of Users” I’m trying to get should be 20% since there is only one User completed the Goal. Unfortunately, I’ll end up with 200% “Conversion Rate of Users”.
Anyone has any suggestions?
Sameh: It is hard to evaluate what might be wrong without logging into your analytics account and checking what you have set up.
You can hire a GACP who can easily help with this. Here’s a list: https://bit.ly/gaac
Avinash.
Thank you for this tips for smart calculated metrics.
What is a GACP? Google Analytics something i am guessing…
Cory: It stands for Google Analytics Consulting Partners. Now they are called Google Analytics Service Partner. I’m sure the name will change again. :)
Regardless… Consultants approved by Google to solve your analytics challenges. http://www.bit.ly/gaac
Avinash.
Thank you for these analytics tips and tricks, we will bare these in mind.
Hi Avinash, I know this is an older post now but I’d just like to be the latest to say thank you!
I’ve been using GA for a long time now but never really configured it or used it in this way and yet it makes perfect sense.
Thanks for sharing this, I look forward to reading more of your posts :)
I love this post – sadly come across it a couple of years late!
Calculated Metrics to show Conv Rate Per User is great for Lead Gen where we need as close to 100% as possible!
Thanks for sharing :)