
 Web Analytics tools have become pretty feature rich, and the future promises to bring even more goodies (Universal Analytics anyone?). But these features bring with them new problems that we hadn’t imagined before. Mostly because the limitations in the tools meant we were unable to make these mistakes.
Today’s post is about a new problem I’m starting to notice, which only exists because our tools have become so much cooler and handed us so much power: constant mismatching of hit- and session-level metrics and dimensions.
This particular problem exists primarily because Analytics allows us to create custom reports. In some scenarios you also bump into it when you do advanced segmentation and filtering.
The danger is that most of the time we don’t even realize we are making a mistake because after we create our report we see numbers and they look like real numbers and it looks like something is happening. But it is all fake datagasams.
Let’s define the problem, let’s understand the optimal mental model, and let’s look at some examples to firm up our learning.
I promise you, next time you log into SiteCatalyst or dive into Discover or surf with WebTrends or play naughty with Google Analytics, you are going to be a lot more cautious. :)
Hits? Sessions? What are we taking about?
To understand this problem we are going to have to get a little bit technical. It is very important context.
[It will be critical that you are familiar with what a metric is and what a dimension is. In the small chance you need a refresher: What is a dimension? + What is a metric?]
Say you type in a URL and visit a website. The very first page (usually the home page) starts to load, which triggers the web analytics javascript code on the page…

The javascript code sends data into the Cloud to your analytics tool. This data gets recorded as a “hit.”
Any individual interaction that you have with the site is called a hit. Most typically a hit is a page view. But it can also be an event or a custom variable (if the scope is set to “hit level”).
As you browse through the site, you keep sending hits back to the analytics tool. “The visitor just requested a product page.” “The visitor added something to cart.” “The visitor started a video.” “The visitor started the checkout process.” Etc. Etc.

Hits here and hits there and hits everywhere as you engage with the site (mobile, desktop, mobile app).
For each hit, a bunch of data is also being collected (ex: you saw page x for y minutes).
A collection of hits form one visit to the site (entry and exit, or entry and leaving tab/browser open for 29 mins of inactivity), and is called a session.
That’s the purple box…

Here’s a helpful picture that you can use to remember the difference between hits and sessions. Hits are the collection of small things. The session is collecting those hits into one cohesive experience.

Custom variables has an asterisk next to it because there are three types of custom variable: visitor-, visit- and hit-level. Only the last one, obviously, qualifies as a hit.
Now that we understand hits and sessions, let’s dig deeper into the core reason for this post.
Hits are from Venus and Sessions are from Mars.
The visitor, let’s call her Kim, comes to the site. Kim leaves (like all parents, after making an expensive purchase for her daughter!).
The analytics tool collects loads of data about her visit related to the hits, the individual interactions. Examples of these hit-level metrics are things like Time on Page, Bounce Rate, Page Value, Page Abandonment Rate, and others.
These metrics only correctly measure, and can only accurately be used to report, what is happening at a hit level – i.e., the small individual interactions.
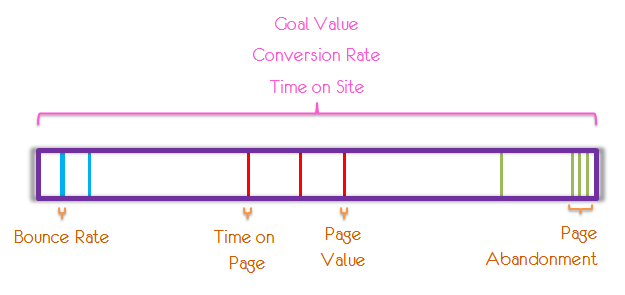
Then there are metrics that measure what happened at the overall session level: Time on Site, Goal Value, Conversion Rate, and many others.
They are meant to only identify performance of the purple box.
Punch-line: You can only use hit-level metrics to measure hit-level dimensions, and you can only use session-level metrics to measure session-level dimensions.
[Once again, definitions: What is a dimension? + What is a metric?]
For example, it is wrong to have Search Keyword as your dimension and measure Page Value for that. See the problem? Session-level dimension (you are looking at what started the whole session) being measured by a hit-level dimension (what happened with one blue, red, green bar above).
What’s the fix? Use Goal Value.
Another example, it is imprecise to look at Pages (a hit) and measure Conversion Rate (a session-level metric) for it. One blue, red, green bar can only be measured for a metric that is at its optimal altitude and not a metric that is for the whole visit (what about the other hits?).
What’s the fix? Use Page Value.
When it comes to custom reporting, we mess up this calibration all the time. We measure hit/session dimensions using session/hit metrics! Sadly, this is a silent death because you don’t even realize you are messing up.
Of course that is not going to happen any more. You’ve read this post.
Examples: Calibrating Hit- & Session-Level Metrics Optimally.
Once I started to look at this more carefully I realized that many web analytics tools, even in the standard reports they provide, mess up. So look at your standard reports very carefully when you log into your analytics tools. Otherwise big data is going to bring tiny insights.
Here’s a standard report from Google Analytics.
We are looking at a session-level dimension, Source/Medium (where do visitors come from?).
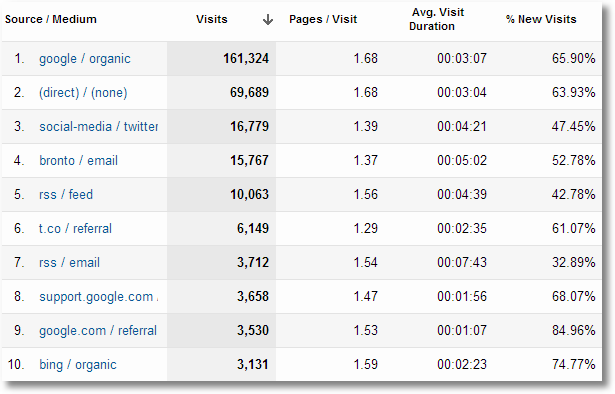
This report is calibrated properly because Visits, Pages/Visit, Avg. Visit Duration, % New Visits are all session level metrics.
If you are not sure of why, scroll back up just a little and ask yourself: Are these metrics measuring the purpose box or the blue, red, green bars? Clearly, they are measuring the purple box. You can’t have Pages/Visit for an individual hit, right?
Go look at the Landing Pages report. What do you see? Do you agree that the standard report is showing all hit-level metrics for the hit-level dimension (page)? You’ll see that it is not that straight-forward.
What about the Geo Location report or the mobile devices report or your adwords campaign reports?
It stretches your brain to think this through.
Now, let’s look at a custom report, which is typically where we all make this mistake.
In this report I’m looking at the Time on Page, Avg. Time on Page (I was not sure which of the two to use) and Page Value.
Lesson one is that Google Analytics continues to include astoundingly value-deficient metrics like Time on Page. This metric, it seems, is the summation of all time spent by everyone from a source. I’m struggling to imagine a single scenario, no matter how remote, where anyone could find this of value. I don’t understand why these value-deficient metrics continue to live year after year! Rant over.
Let’s consider the other two…
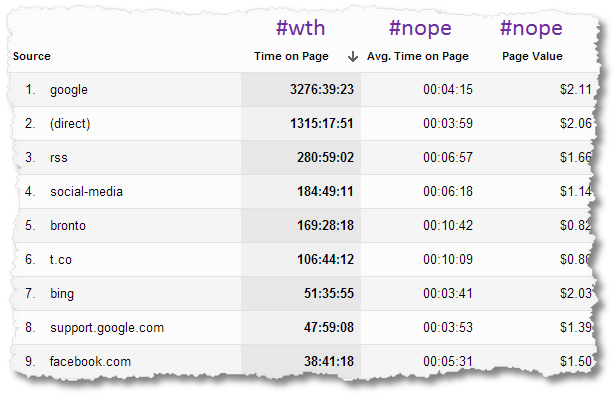
Average Time on Page is, by its definition, a hit-level metric. It measures what happens on one page. Looking at it at a session level is silly. After all, what does that 04:15 for Google actually mean? And what page’s average is it?
Ditto for Page Value. That metric (and it is awesome by the way) is supposed to tell you how much economic value was generated by each page on your site. It can only be looked at for a hit-level dimension (Page or URL).
The silent death part is that as you stare at the table above it looks like something is happening. All the numbers are different. You might say t.co (twitter essentially) is fantastic at 10:09. But that is just a garbage number. Or you might look at $2.11 and celebrate Google (and you should, but) that would be unwise because you are looking at the wrong metric.
But unless you are careful and know to match hit-level metrics with hit-level dimensions, you would likely make big mistakes in any recommendations you make on this data.
So what is the optimal way to measure Sources of traffic? Use session level metrics…

Unique Visitors? Yep. Avg. Time on Screen? Only the lord knows what that is because even the Google Analytics Help Center fails to find this metric. But the metric is there when you are trying to pick time-based metrics. I know, I know, I should just let the GA team make our life miserable and move on. Okay, moving on … Average Visit Duration (also known as Avg Time on Site in other tools) is a perfect match here. And my absolute BFF Per Visit Goal Value is a perfect match because it is a session-level metric (it measures what happens over the entire purple box).
[I love PVGV because it measures not only e-commerce value – the macro conversion – but also goal values – the micro conversions! It forces each site owner to solve for 100% of the traffic rather than just the 2% that convert. I know of no better way to win on the web than to solve for 100% of your visitors.]
So you are all set now?
Match hit-level metrics with hit-level dimensions. Match session-level metrics with session-level dimensions. Life will be rosy.
Not yet all set?
Ok, let me share a couple more examples…
Here’s a report by one of my Web Analytics Master Certification course students. They’d submitted this early in the course.

They are reporting on a hit-level dimension, Page.
You can see that they did ok with the first two metrics, Entrances and Bounce Rate are both really great hit-level metrics.
But then the rest of the stack contains session-level metrics. Per Visit Goal Value can’t be measured for a hit (page) because it is only computed for the entire session. Ditto for Transactions. And you paid a cost (campaign cost) to get Kim to come to your site, but that has nothing to do with the page (it has to do with the visit, or to put it another way, the session). Same thing for Cost Per Acquisition – it’s not a hit-level metric.
This was early in the course so we were able to correct the learning, but at this time this wonderful student had analyzed this data, later even applied advanced segments to it and recommended a bunch of actions. Only the actions were based on wrong data.
So be very, very careful.
One last quick example to really, really nail this down.
In this case, we are looking at hit-level dimension again, Page.
With the first metric, Visits, you would not be doing something totally imprecise, but it is super clean to use Unique Pageviews if you want to know uniquely how many visits was a page present in. If you want to go deeper, how many times a page is seen during one visit, use Pageviews. That would show how many times Page X was viewed and how many times it was unique in a visit. Nice!

The second and third metrics above are tricky. You feel like a page should be delivering Goals and Conversion Rates. Nyet!
An individual page does not deliver Goals and Conversions. Each page just moves the person to the next one in the session. It is just one hit amongst many that happen during a session. All the hits banded together to deliver the completion and conversion rate.
And see what I mean by the silent death. It looks like you are looking at some numbers and they are all different so you can read something into it. Nope.
So what’s a better replacement here? Page Value . Because in computing that hit-level metric all the credit from goal completions and conversions is taken from each session and “distributed” to the hits present in that session. That helps you understand how each hit did (across multiple converting sessions!).
A little complicated. But not really. Right?
Exceptions to the Rule.
Bounce Rate is a great exception to the rule.
In this post we have used Bounce Rate to measure the performance of a hit, pageview.
But you can also measure Bounce Rate for a dimension, sources of traffic (keywords, referring URLs, campaigns, etc).
That’s because in sessions that bounce, there is only one hit, the first pageview. Then nothing happens. Since the session = the hit, bounce rate can be used to measure performance of either session-level dimensions or hit-level dimensions.
It makes total sense. But I wanted to point out that sometimes there are gray areas. Good news, they are rare. :)
Closing Thoughts.
I’ve created this little picture for you as a quick something you can reference.
On the very far left of the top half are examples of dimensions. Campaigns, geographic locations, sites sending traffic, etc.
Then we see examples of metrics we have access to for measuring the overall experience Kim had on our site and the result of that experience. They all measure her session, they are session-level metrics.

Finally at the bottom we have examples of hit-level dimensions and metrics. Small interactions that happen during the course of a visit to your site/mobile app, and the metrics used to measure their performance.
If you calibrate your hit-level dimensions and only use hit-level metrics, you’ll find accurate tactical insights about improving individual pieces of Kim’s experience.
If you calibrate your session-level dimensions properly and only use session-level metrics, you’ll find accurate strategic insights about improving big things (your overall acquisition strategy, your product mix, your strategy on macro and micro outcomes, etc.).
Remember: Friends don’t let session-level dimensions drive with hit-level metrics!
Good luck!
[Bonus: In case you use Google Analytics, you’ll find this page to be of value: Dimensions & Metrics Reference Guide]
As always, it is your turn now.
Does the guidance above make sense to you? In your company do you pay careful attention to calibrating metrics at the right hit/session level? Do you know of other standard reports in your analytics tool where this mistake is made? Are there other metrics you feel also fall into the gray area? Got a big “d’oh” moment you are comfortable sharing? Confused about whether a particular metric fits in the hit-level or dimension-level category?
Please share your feedback via comments.
Thank you.















190 thoughts on “Excellent Analytics Tip #23: Align Hits, Sessions, Metrics, Dimensions!”
As always, an excellent perspective.
I’ve seen clients go wrong on this quite a few times – it’s the old GIGO rule.
I admire that you also continue to poke holes at GA – while it’s a great tool, there are definitely some areas for improvement, such as removing meaningless ‘Time on Screen’ metrics.
I thought Time on Screen referred to the time visits spent on a single screen within an iPhone/Android App?
Ash: It does.
But when you are trying to create an custom report that is not clear. This is what it says when you click on the question mark icon: “The average amount of time visitors spent viewing a specific screen or set of screens” That does not help.
And when you go to the official Analytics help center, there is no mention of this metric: https://goo.gl/YuIRR
So how is one supposed to know what it is and how to use it? I was referencing that frustration.
-Avinash.
Hi Avinash,
First of all: thanks for all the effort you put into each and everyone of your post. You are my hero!
I completely understand your frustration with the help centre, although one of the fantastic attributes of Google Analytics is the community driven content, which other suites such as Omniture, WebTrends, etc. have yet to achieve.
Thanks very much for great article!
But please can you explain ga:totalEvents ga:sessions metrics – are they session level? Do additional levels exists or only hit and session’s levels are possible?
And can you explain right context and usage of ga:totalEvents ga:sessions metrics?
Artem: A detailed guide to using Event Tracking is here: https://goo.gl/nWWfxO
As you’ll see in the example described there, you usually record hits with Events. A collection of hits (for page views, events, other things) rollup to activity in a session.
If you need more help with specific questions, please do not hesitate to reach out to a GACP who can help you: http://www.bit.ly/gaac
Custom Variables, if you are interested, have different scope you have to set. You can have a CV at a person, session or a hit level for example: https://goo.gl/ugeyRi
Avinash.
This is really something unique you’ve identified and notified us to go back and recheck our tools to bring more proper insights to the client’s desk.
I didn’t even ever notice that there is some kind of hit-level dimensions, hit-level metrics, session-level dimensions and session-level metrics. Now it is very clear for me to identify what-is-what as I’ve read this post and can easily use the hit-level or session-level dimension or metric.
Thanks for also clarifying us about the bounce rate that can be used to measure the performance at the hit-level and session-level.
Great article and really important to bear in mind.
Often I have management ask the question “How well do [x,y,z] pages convert” and produce a chart and get unusual results – whereby what we know intrinsically are less powerful pages for conversion, they end up higher rated. (Often low value items – as a cookware & kitchenware retailer for example we find cleaning cloths according to our reports contribute a lot to conversion – not sure I’m convinced I would feature them on the homepage however!).
Normally we discuss the results and then agree that we disagree with them, but nothing else comes from that. It’s a point thats often overlooked without consciously thinking about it – after all, our logic that calculating how many conversions a given page was driving – seemed sound.
Whereas really a page may be visited frequently by different visitors, but actually not contribute a great deal towards a final conversion.
Avinash,
I always get excited when I see a new post of yours come across my reader.
This was such an eye opener and even though I have learned this from you in the past, I am going back through all my custom reporting and finding a few of these issues.
Thanks again for the excellent description and examples you always make this so clear and keeping us Ninja want a be on our toes.
Kevin
Kevin: It is funny but I have a note to myself, after I’d finished this post, to go back and check the custom reports I’ve shared on this blog to make sure that I’ve aligned hits and sessions optimally!
I’m confident some of them were imprecise.
We learn. We grow. We learn some more. :)
Avinash.
I wanted to say that I did understand the overall message & purpose of this post- however as a newbie to customizing GA I am intimidated on HOW to create a specific session-level or hit-session report.
I know for someone who knows GA backwards this is child’s play so any help would be appreciated.
Danielle: I’m glad this post was helpful. :)
It is complicated. For now I would encourage you to keep this question in mind: Is this “thing” I’m looking at a discreet individual interaction, or does this “thing” represent the entire experience.
That will provide clarity on the altitude of the “thing.” Then you can ask the metric or dimension question.
-Avinash.
SiteCatalyst does to a certain extent, but I don’t think it is perfect.
Not to split hairs, but I think custom variables aren’t hits but dimensions sent together with hits e. g. a pageview or an event.
Nico: I appreciate the point. Please allow me to clarify.
But remember what we are deciding first. Are we looking at hit level or session level for x? After that, is x a metric or a dimension?
If a custom variable, to use your example, is sent along with a hit (page view or event) then you are looking at hit level data. Then you decide is it a metric or a dimension.
In the final picture perhaps I should have made this more clear but custom variables (hit level) are shown with Page and Events the other two common hit level dimensions.
Does this help?
-Avinash.
Pingback: Geek Reading March 18, 2013 | Regular Geek
Your post does a great job crystalizing the importance of matching what you are measuring to the dimensions of the data.
One question around your discussion. I took it to imply most dimensions are either session or page level dimensions (not both). But are there not dimensions that could apply to both? I think of geography or device that would have value in analysis at the page or session level.
Trevor: Ahh… you would like to complicate things even more! Let me try to apply the Occam’s Razor. :)
1. Dimensions can be either hit level or session level.
2. Metrics can measure performance of any dimension – at a hit level interaction altitude or a session level experience altitude.
With that in mind, let’s look at your examples.
Geography (where the visitor is location). It is definitely a session level dimension (and does not change with every hit). You can measure it at a hit level I suppose, “where do people who see this page come from.” Analytics definitely lets you do that. But for the most part you’ll analyze at a session level, “what are the conversions for visits from Moscow/China” or “what keywords drive more traffic from the UK when compared to India” etc.
Page Load Time is a hit level metric, you could measure it by Geo (a session level dimension). That would be ok. But for the most part you’ll look at site load performance by Geo, rather than page level, because it is much much easier to optimize.
Bottom-line: Slight gray, but remember 1 and 2 above, apply a pinch of commonsense along with “what can we actually do with this analysis” thought.
Device (iPhone, S3, HTC One), is also a session level dimension. Analytics will allow you to measure hit metrics or session metrics for it. But, even more than Geo, I feel that almost all analysis that might be of value will look at session level metrics.
Hope this helps.
-Avinash.
Maybe I’m missing something, but why doesn’t the tool guard you from making the mistake of mixing session and hit dimensions and metrics? SiteCatalyst does to a certain extent, but I don’t think it is perfect.
This strikes me as a disservice to the users, especially novice ones.
Andrew: If WebTrends or Google Analytics or Adobe was to blame, it would only take a few more words (beyond the two rants I made in this post about Analytics) to blame them.
Sadly you can’t blame the tool. If you want a scrape goat, and I might suggest that is a sub-optimal quest, you’ll find it in our ecosystem’s complexity.
You are only partly satisfied with SiteCatalyst’s guarding because it simply can’t guard. That is amply illustrated in comment threads above. For a specific example, please read my reply to Trevor – see what I mean when I say this is hard to determine and hard code into the tool?
Our protection against the ecosystem complexity is to make ourselves smarter, rather than rely on the fact that the tool providers can do it for us.
-Avinash.
Great post Avinash!!!
And one question please: is landing page is a hit dimension or session?
You can look at the landing page as regular page but you can also look at this as the “source” to the site. Exactly like source/medium etc.
For example: I want to look if entry via some landing page give the visits better value, maybe the landing page convince the visitor to complete more goals during his session.
What do you think?
Shuki: I gave a hint about it in the post above, but deliberately did not go too deep into it. I wanted to keep things simple. Let’s get complicated!
The easy part: The Landing page is not the “source.” It is not a session level dimension (except in cases of bounced sessions where, because of the bounce, it is the only hit). Landing page is a hit.
The hard part: Most of the time people don’t bounce, they go on to create many more hits. So the landing page can’t be judged based on session level metrics. We would be placing too much weight on the shoulders of that little guy. (If all other pages are losers, or even some, then who really cares how good the landing page was? And why blame it?)
For this reason I’ve consistently recommended that you should judge a landing page for the job it is supposed to do: 1. Not cause people to bounce. 2. Get people to the right next page. Both would be hit level metrics.
But as you open your favorite analytics tool from Baidu or IBM or Adobe, you’ll notice that the landing page report mostly contains session level metrics! It is a manifestation of their belief that the landing page essentially determines the ultimate conversion.
I respect that perspective. I take a different path based on my optimization experience. And you have to determine for yourself (based on data, not opinion) what will work for you best!
-Avinash.
Of course its not “source” but its the first page the visitore see so it have more impact on the visit than other pages.
But… you right – “If all other pages are losers, or even some, then who really cares how good the landing page was?”
This answers broaden the reflexion and partly answers to Lokesh’s question.
In your book Web Analytics 2.0, you answer to that question:
“How effectively does my home page engage Visitors so that they read lots of my content? Put another way, how good was my first impression?”
From the Dimensions and Metrics lists, I drag over the metrics I need: I take Page Depth first and then Visits where Visitors have seen more than three pages (a high degree of engagement—see Chapter 3). Next I choose Landing Page, because I want only those people who start browsing at my home page and not people who entered deep in my site and then surfed over to the home page.
So you use session based metrics (page depth) to measure your home page (a hit level dimmension). Did I miss something?
Hi Avinash,
This is my first feedback, I read many of your articles and watched videos too. They are absolutely wonderful for anyone with zero experience to advance level experience.
The reason to write this post is, since few days I was going through such dilemmas for making my banner report. While defining banner performance I was taking Hit per visit as on of metric, always had a feeling that it is not appropriate to use but with this post I got the answer. Thanks for such a remarkable and brilliant post.
I know you are a busy man, if I can request you to write a post on, how to define the Home page performance of any eCommerce website. A typical homepage will have few best selling products, few navigation links to reach here and there on web site, few banners (may be of one or two types) few fixed links etc. The biggest question here is, What should good look like when it comes to give home page performance.
If you can throw some thoughts on this in your free time it would be great.
Once again thanks for sharing whatever you share.
Pingback: Marketing Day: March 18, 2013
I can’t tell why it’s not clear on the interface what are visit/hit level dimensions and metrics. I know that Google Analytics does some kind of separation because once you select a metric or dimension others might become unavailable, that feature is trying to avoid the things you say here, but there are clearly some open gaps.
I assume that in the future we are gonna start to see yet another level, VISITOR level metrics and dimensions.
Eduardo: Please see my reply to Andrew’s comment.
You’ll also find some valuable context in the reply to Trevor and “the hard part comment” to Shuki.
Bottom-line: It is not completely cut and dry. The GA, Adobe, IBM can only do so much. The onus is on us Analysts to absorb the framework and then apply it to our daily work.
And yes, you are absolutely right. There will be one more level, Visitor, in the near future as all vendors shift from being visits based to Visitor based (like Kissmetrics already is).
In context of this post, we will have: hits, sessions, people.
Metrics like Frequency, Recency, (both of which are imprecise currently in pretty much all web analytics tools) and Lifetime Value will be amongst the “people level” metrics.
-Avinash.
How does this perspective mesh with the usual A/B testing (content experiment) scenario? Users are presented with two different variants of a single page. Presumably whether they hit variant A or variant B is a hit level metric. But isn’t the usual measure of success (is variant A or variant B better) in a test like this a session level metric like conversion rate? Is this not mixing hit level and session level metrics?
It seems to me that the problem is uncertainty (which grows with session length) in inferring a connection between a single hit level metric and an overall session level metric. In the degenerate case of a bounce it’s clear that the hit metric is 100% correlated/responsible with the session level metrics. With a two page session the split might be 50/50 (or 10/90 or whatever) in terms of which of the page views (or associated hit level metrics) is ‘responsible’ for the session level metrics. With longer sessions it becomes more and more suspect to assume that any particular hit level metric can claim any responsibility toward a given session level metric. But that doesn’t mean there isn’t an association. If 100% of sessions hitting a particular page are converting and 0% of sessions not hitting that samepage aren’t converting then you can be pretty confident that hit level metric is related to the session level one. Of course it’s probably your payment page so you should have already noticed.
So I think an abundance of caution is certainly warranted. But saying the two ought never to mix seems a bit extreme. To answer my own question in the A/B case the testing tool ought to be tracking the stats and not allow you to claim a correlation until there really is one. If you’re drawing connections between hit level and session level metrics outside a testing tool the onus is on you to make sure the stats really stand up to supporting the correlation. I’d be interested in hearing about methodologies for drawing those sorts of numbers out (and whether it’s ever really worth the effort).
Sean: You are NOT saying this but your comment reminded me of this… “just because finding a doctor is hard, you should not chop off your hand as a cure for a hairline fracture.”
:)
So, we should measure hit/session dimensions only with the optimal metrics, even if it is hard. Until you bump into the grey areas (and in the comments in this post we’ve exposed so many grey areas).
Ok, on to your very important question.
I do not believe (staying consistent with my reply to Shuki) you should judge landing page testing by how well they convert. Besides the fact that you are using session level metrics to measure the success of a hit level dimension, you also bump into the issue of how influential a landing page can be. What if the page after the landing page stinks? Or that next page is ok, but the product pages are horrendous? Or something else. [As you rightly say…] The longer the Average Pages to Conversion, the less the influence of a landing page.
But because of how A/B and Multivariate testing are pimped, neither one of us can get away without measuring conversions in our tests. So sad.
What I end up doing is 1. Configure the test to measure conversion rate, and 2. Also measure how well the various versions did in doing their job (sending the visitor to the desirable next page).
Many testing tools make it easy for you to set two goals, and to measure statistical significance for both. I use the combination of those two to make the best decision (actually I’m lying, #2 has a huge influence on me! :)).
Integrating your analytics tool with the testing tool makes this easier to do. [Plus Bonus: Then not only can I measure the impact on the macro conversions, I can also do so for the micro conversions.]
Thank you for bringing up this excellent point.
-Avinash.
I’m a bit confused by your reply. Let’s say we run an A/B test (say on a landing page) where we randomly assign visitors to one of the two treatments (say with two different wordings of a call to action) and then tie the experiment to a session level metric like conversion (say a payment on some other page). We run the experiment long enough for the stats to say there is a statistically significant different between the two treatments (say A converts at 12% and B at 8%). You seem to be saying (and correct me if I’ve misunderstood) that we can’t really claim that the call to action had anything to do with it because it could be that the “page after the landing page stinks? Or that next page is ok, but the product pages are horrendous?”.
But the entire point of assigning visitors to the treatments randomly and waiting for a statistically significant difference to appear is that that approach cancels out *all* those other effects. We can claim (unless the entire practice of statistics is invalid) that A is meaningfully correlated with an increase in conversions.
Of course it may be that call to action A inspires people to more frequently go to page X and B inspires people to go to page Y. And it actually may be the case that it’s the text on page X (rather than Y) that’s actually causing people to be more engaged and thus is the more proximal cause of the actual choice to convert. But that doesn’t change the fact that A is meaningfully correlated with more conversions than B. And that we’d be better off with A’s call to action than B’s.
Of course if we’re really good we’ll also notice that conversions are even more highly influenced to convert by page X (even for folks that never see the original landing page) and do more work to get people into there.
There are many variables (most of which we’ll never measure) that influence a particular decision to convert (or whatever our proxy is for ‘that which matters’). It’s important to separate those that have a small (or no) influence from those that have a strong influence so that we can focus on the later. Jumping the hit/session divide is one thing that’s likely to bump a variable toward less influence (or more precisely make it hard to determine the level of influence). But because we thankfully only have to pick trends (rather than predict individual behavior) we ought to be able leverage stats to help us. Of course in many (most?) cases there is lower hanging fruit.
Sean: It is the last part of your comment. On paper we all know exactly how it’s supposed to work. Unfortunately unlike in a science lab, there are a many more uncontrolled variables at play for us. That is ok.
The nice thing is that we don’t have to believe everything we read! We can simply try things. It has been a great deal of fun for me to configure my tests with multiple goals and see what I can learn. To ensure I can do segmentation in SiteCatalyst based on Test and Target experiments and analyze the complexity of behavior – beyond conversion.
-Avinash.
Hi Avinash and Sean,
Very interesting post and you have answered to the same question I had while reading it!
Another question that I always have when setting up A/B experiments is about what is the ideal definition of conversion rate in the context of an A/B experiment focused on a specific site category / journey / section?
I will give you an example:
On a clothes retailer we are running an experiment specifically focused on the trousers pages but not on the shirts pages.
What should be measured?
1) Anyone going to the test page then converting from whichever journey/product category even during a returning visit? From an attribution point of view this is probably the best option – seeing the bigger picture and not worrying about the rest.
2) However, we may end up with hard to interpret data doing this… Let’s say a visitor lands on a specific category e.g. trousers but then goes on and buys a shirt and we are testing on a specific site category – trousers. Should we measure the overall conversion to ensure the lift in trousers does not cannibalise our shirts traffic? Or should we set up more targeted metrics to filter out site journeys that are irrelevant to our experiment – keep only the completed orders with at least one pair of trousers and exclude for example shirt only orders.
Probably one should measure both to see what really happens but we need to be sure the experiment results won’t be confusing with too many metrics.
This is also another reason why conversion rate is not always going to give us a true reflection of what the experiment is really doing and the direct hit metrics you suggest are much more effective.
Helena
Hi Avinash, what if the goal/ conversion spans across several sessions/days, with multiple entries on the landing page?
Is there a way to create custom reports that can attribute back to the initial traffic source?
Also, would I use session or hit dimensions/metrics?
Edmon: A small word of caution first. It seems you want to do path analysis over multiple visits. Essentially almost linearly organize every single hit, starting with the first visit’s landing page and all other hits across multiple visits to the site to the final set of hits in the final visit that lead to the conversion.
If this is what you are trying to do, might I humbly suggest that it might be a value deficient exercise. We have a hard enough time analyzing this for as single session and it rarely leads to any value (see: Why Path Analysis is a Waste of Time). I would say never, but never say never. :)
Your question was where you can see goals/conversion that span across multiple visits. In Google Analytics go to Conversions > Multi-Channel Funnels > Top Conversion Paths. It ties all the way back to the initial traffic source.
On top of the report if you click on the button right under Conversion you can pick the Goal/Goals you are interested in.
On top of that you will see Conversion Segments. You can apply many amazing segments that are built-in (First interaction is Referral or Paid or Direct, Time lag is greater than one day etc) or create your own.
To your last question… go back to the last graphic in this post. You are analyzing the purple box. In fact you are analyzing the same person across multiple purple boxes. If you agree, then the dimensions automatically are session level (they are actually “people level”, see my comment above to Eduardo), and the metrics will be session level.
Use the graphic as your guide. I do hope this helps.
-Avinash.
Ah yes, I recall the cautionary webcast you did about path analysis when I took the Market Motive course a while back and how it is a waste of time.
I appreciate your help with the Multi-Channel Funnels, as this feature did not yet exist when I took the course, and these tools will certainly become valuable to me at some point. I think my problem is more about tracking (which 2 GA consultants were unable to solve). Hopefully universal analytics will come to the rescue!
Great post Avinash!!!
Excellent post, and I’m a huge fan of this blog.
I’m wondering if there are exceptions here.
“So no Visits and Unique Visitors (dimension metrics) for Page (a hit), rather, use the more accurate Unique Pageviews and Pageviews (both hit-level metrics).”
The thing is, when using the acquisition-behavior-outcomes model on things like the landing page analysis (https://www.kaushik.net/avinash/google-analytics-tips-data-analysis-reports/), it really, really, really helps to use visits so everyone’s talking about the same thing, from top to bottom.
Total traffic is reflected by session-based items rather than hit-based ones, typically visits. By adapting to hit-based pageviews for important custom reports for pages – say, engagement and Landing Page Analysis – we’ll risk creating orphans out of those reports.
Can you talk a little bit more about the risks here?
Jeffrey: You should adapt to the conditions in your company. If using a imprecise metric will mean progress, then go for it. Honestly.
I would probably explain the reason why Visits is not completely precise (yet not the worst offender on the list) and why Pageviews is a much better measurement. I would probably try two or three times to get people to use the perfect metric.
If that does not work, I’d probably give up for a while and fight other fights.
To your last point, I do not believe you end up creating “orphans” by using Pageviews and Unique Pageviews (rather than Visits and Visitors for page, a hit level dimension). But see above.
-Avinash.
Thanks, Avinash, and great post.
There’s something to be said about getting the data right as much as possible, so if introducing UPVs into a discussion about task outcomes is what it takes, then that’s where we’ll go as much as possible.
Great post as always, Avinash.
Thanks for bringing attention to something that I’m sure most people (myself included) have not considered when looking at and thinking about what a report is saying you (if anything useful at all).
Would I be right in that matching sessions to sessions and hits to hits also applies when applying secondary dimensions? Mixing hit-level dimensions with session-level dimensions already lose meaning, regardless of metric?
Shockley: Refer back to the last image and use it as your guide.
Let’s use an example….
You are looking at Traffic Sources in a table along with Visits, % New Visits, Conversion Rate, and you now drill down to the secondary dimension Page.
What is that we are looking at now?
People from Bing who see pages x, y, z and their Conversion Rate? That falls apart.
Or visits from AOL that went to page x and the % of New Visits, but does % New Visits apply to sessions or hits? It falls apart.
So I got through exercises like this to help me figure out if I’m calibrating the altitude properly.
I’ve not thought through all the permutations and combinations, but I suspect the rule to align sessions level dimensions and metrics and hit level dimensions and metrics applies when using secondary dimensions as well.
-Avinash.
Very true, ultimately it’s about going through those thought exercises, so that the numbers we look at have meaning (maybe until GA automatically returns N/As?).
Thinking a bit further about “exceptions to the rule,” Landing Page and % New Visits could possibly bridge the Hits-Sessions Expanse too. Landing Page (hit-level dimension) is still the same across an entire session, so it could be combined with something like % New Visits (session-level metric) that’s already defined at the first hit.
Perhaps the process for solving these questions is to see if we can reduce the definition of a dimension/metric to a common hit/session denominator. If for all intents and purposes a dimension/metric’s hit=session, then it can used. But then again it might just be specific pairings that work, so always verify! :)
Shockley: Perhaps you can think of the landing page metrics with this perspective…. Is the metric I’m using dependent on the Landing Page’s performance? Is there anything the page can do to influence that metric?
What that question, it is hard to say that landing pages have anything to do with new visitors or returning (that is a source / campaign dependent variable).
But analyzing behavior of new visitors on landing pages, vs returning, is a good exercise.
Here’s how you would do it:
1. Create a landing page custom report with hit level metrics (so metrics dependent on the page’s performance).
2. Apply the New Visits and Returning Visits advanced segment to that report.
3. Boom! Rejoice, now you are seeing how well, or badly, the landing page does for those two visits.
-Avinash.
Yes, good point. Looking at the cross between Landing Page and % New Visits would be for the purpose of seeing how it performs for New vs. Returning Visits.
Landing pages themselves have no inherent gravity to encourage new people to check them out. :)
Avinash,
Another post filled with great insights. The amount you share is truly staggering. I am, however, wondering if your thought leadership on web analytics is going to result in confusion over the definition of “hit.” From the very beginning of the web, a “hit” has been defined as:
A hit is a request to a web server for a file (web page, image, JavaScript, Cascading Style Sheet, etc.)
https://en.wikipedia.org/wiki/Hit_%28Internet%29
https://www.techterms.com/definition/hit
Younger web analytics pros who have no experience with log file analyzers might not be aware of this definition, but old-timers like me certainly are. :-)
Dave: Ha, ha! Very, very good point. And as a fellow “old person,” that thought did cross my mind.
But when I speak to the engineers, they use hit as I have in this post (darn young people!). Hence I decided to stick to this slightly different usage.
And you’ll get a kick out of this, in writing the post I was also reminded of the old web analytics adage: “Never use hits to measure success because hits stands for How Idiots Track Success!” :)
Avinash.
PS: I appreciate the kind words, I’m so glad you continue to find the blog to be of value.
Out of the World as always.
The way you teach, deliver is just amazing. Learned a lot from this post.
Cleared my concepts regarding, Session Level Dimensions & Metrics and Hit Level Dimensions & Metrics.
Thanks
Best Regards
Pingback: SEO content marketing roundup, week ending March 20th
Great Article!
Hi Avinash!
Great post. One question about unique visitors and pages. According to Google
“A unique pageview represents the number of sessions during which that page was viewed one or more times.”
And a unique visitor is the number of times a cookie is set on a device. If I want to see how many unique people have seen my specific page wouldn’t it make more sense to use the unique visitor metric on a page level?
If I use the unique pageview metric I don’t get the number of unique people, only the number of sessions. Meaning one person can visit a specific page a number om times (session) and increment the unique pageview count for that page for my period.
I hope you understand what I mean.
/ Niklas
Niklas: Your understanding is right, the mistake in this case is mine. In explaining all the complexity, I misspoke on this account. I’ve fixed the error in the post.
But let me explain it again here.
For pages we should use Pageviews to measure how often the page is viewed. We can measure it in aggregate, Total Pageviews. We can measure it as how many times per session, using Avg. Pageviews/Visit.
We should not use Visits (a session level metric) to measure how many times uniquely during a visit a page is seen (essentially a de-duped count). We should use Unique Pageviews.
To measure how many “people” have seen a page, we can use Unique Visitors.
UV is not a session level metric, it is a “people level” metric (I touch on this in my reply to Eduardo). We don’t cover that in this post (will do after analytics tools release true Visitor level segmentation). But it does work in this case to use it with a hit based dimension, Page.
Thanks so much for reading the post carefully and asking this question. Please let me know if I’ve not provided a clear answer.
-Avinash.
Hi Avinash,
Thanks for yet another great post. I just read your reply to Niklas’s question above about using UVs as a metric for the Page dimension. As a follow up question- can you clarify why that pairing works?
I’m a little confused because I thought the “people level” metrics and dimensions are on an even broader level than session-level metrics and dimensions. So if we can’t pair visits as a metric against Page as a dimension, why would it work with unique visitors?
I tried the Page vs Unique Visitors pairing by pulling a report to determine the % of Unique Visitors that have visited the 4 key sections of my site in a week and saw that the sum of UVs for each section is higher than the number of total UVs that came to my site in that week. I’m wondering if this is normal or if it means that the pairing of Page vs Unique Visitors is giving me invalid data.
Amy
Amy: Here’s the structure: People. Visits. Pageviews.
Or put another way: Unique Visitors. Sessions. Hits.
As to your question, the best answer can be read by understanding the “hotel problem” on Wikipedia. Check it out.
-Avinash.
You always just make our life as a web analyst a bit tough (kidding).
Now we know how to give the correct version of analysis reports to our clients.
Thanks a lot!
Frankly, never understood the meaning of all those graphs, but since you started this series… I have been following and analyzing my own data.
Now I think I understand what a basic analysis is.
Please keep us updated, need to learn lot more.
Cheers
Makes perfect sense, easy to understand (as always) and immensely valuable. Another great post!
Pingback: Friday Catch-Up: Most Important Posts and News on SEO and Online Marketing This Week - Promodo Blog
I Hope that a day Analytics Data becomes relational!
Yes, like relational databases I guess we will not have this king of problems any more.
Cheers, Hedi
Pingback: From my Reading List - Optimiser Prime
This completely crystallized and clarified some of the problems we’ve had with session-level metrics in our analytics recently.
Really appreciate this post – super helpful as always, thanks Avinash!
How exactly is the bounce rate calculated for a informative website. If there is only information provided lets say Wikipedia for an example A site which only provides information than how the exit rate and bounce rate is calculated.
I’m still confused in it.
Any Suggestions,
Regards,
Raviraj
Raviraj: There are many wonderful articles, written by many wonderful folks that explains this really well. A simple Google search will be quite helpful.
For example if you search for “bounce rate google analytics” this is the first article, the official GA help website: https://goo.gl/e1nux It answers your question directly.
If you would like to read my article on bounce rate, you can find it using the search box on this blog, or here’s a helpful link: Standard Metrics Revisited: #3: Bounce Rate
Here’s a summary: Bounce rate is not exit rate. Bounce rate is measured the exact same way regardless of the type of site. Bounce rate only uses page views (in the context of this blog post, hits) to measure your rate, it does not use time.
-Avinash.
Thanks a lot Avinash.
Hope this will help me understand my query…
Hi Avinash, thanks for this helpful post. I have a question about the “but it looks right!” part of your answer.
When I create a custom report with 1) a hit-level custom variable as dimension and 2) a goal completion as the metric, I do indeed get an answer appears to be allocating the goal values. The goal numbers attributed to each hit-level dimension (in this case, content classifications) add up to the total. So my first question is: how is GA currently doing this attribution?
And more importantly, how should I measure effectiveness of content classifications (hit-level custom variables) given that page value does not seem directly relevant?
And finally, I think your post is meant to apply to standard/custom reports, but what confuses me is there are ways to get goal/event attribution to hit-level content via other round-about means: event labels or “goal completion location.” Why not integrate these clearly as metrics in the standard reports? Or are you saying this whole concept of allocating first/last touch to content is misguided?
Hope I am making sense. Thanks for your time.
Carson
Carson: It is very difficult to explain in a short comment why doing the wrong thing is wrong.
It is easier to simply say that if you want to know the value delivered by hit level dimensions, you should use hit level metrics. :) For example for Page, use Page Value.
I’m so sorry but I don’t understand the second part of the comment (or is it the second and third parts). Let me try to see if I can still say something that might help…
In all standard reports GA uses Last Click Attribution. As you know all attribution analysis is happening at a session level.
But Google Analytics has a Attribution Modeling Tool in the Multi-Channel Funnels report that is now free to all GA users. You can apply any seven standard models to your customer conversion behavior, or create as many custom models as you want.
When you use Multi-Channel Funnels report, you are looking at “People level” data (see my comment to Eduardo, Edmon) and doing analysis at a session level. Please use the appropriate metrics.
Hope this helps!
-Avinash.
So is this the reason for seeing “not set” as keyword in Landing Pages report?
Since we are measuring a hit level dimension “landing page” with a session level dimension “keyword”
Nikhil: No, not necessarily. Remember, (not set) means that there is no value for GA to report for that dimension.
Let’s step back. Some people will come to a website via search. They will land on a page. In the report you will see a keyword when you look at keyword as a secondary dimension, or drill down from Page to Keyword.
But some people will come to that same page via email marketing or direct or social media. In all of these cases if you use keyword as a secondary dimension, or drill down to it, you will see (not set).
That simply means you are looking at people who did not come to that page via a keyword.
(not set) will mean different things in different scenarios (keep the definition above in mind). But in this case it means non-search traffic.
Avinash.
Hi Avinash, thanks for this great piece of content.
I agree that the best metric for a landing page is the bounce rate – be interesting and keep the visitor on the site. But when going a step further there’s not much more than per visit value and page value.
With regards to not provided keyword data I’m tempted to use per visit value when looking at landing pages instead of keywords (for example product page entrances)… but my real question is: do you yourself use page value for custom landing page reports to compare performance?
Thanks!
Frank
Frank: In addition to Bounce Rate and Page Value, you can also use Time on Page (though that is only computed for those that don’t bounce) as a metric if time is important for your business.
You can also use the InPage Analytics report (and its equivalent in WebTrends, SiteCatalyst etc) to identify how well the landing page is doing its job of driving people to the paths you want them to go down.
I do use Page Value for custom landing pages report to compare performance (for both ecommerce and non-ecommerce websites).
Avinash.
Hi Avinash, thanks for your reply.
Maybe you can answer this, too: I can’t find GA’s page value metric in the Core Reporting API – is this really missing? https://developers.google.com/analytics/devguides/reporting/core/dimsmets
Cheers! Frank
I never looked at it like this. Thanks for such a valuable post!
I’ll have to be more vigilant with my analytics. Now that I have this information, I can get a better understanding of it all.
Thanks for the refresher and the distinction, Avinash.
I’m careful not to mix and match on these, but it’s good to see a lot of examples.
“Remember: Friends don’t let session-level dimensions drive with hit-level metrics!”
I enjoyed the visual representation of purple box/session and marks/hits. Thank you!
Pingback: Bookmarks for April 7th | Chris’s Digital Detritus
Avinash ,
Thank you for the excellent article. I am wondering how does this apply to advanced segments.
Can I create an advanced segment based upon a hit dimension like a specific page or a session metric like a goal.. Will that create problems?
Yisrael: Yes, when you apply advanced segments you’ll have to consider what level you are looking at.
For some specific examples please see my reply to Shockley and Niklas in the comments thread in this post.
-Avinash.
I’m surprised no one has mentioned the Google Analytics API here. Unlike the interface, it gives you the freedom to fetch up to 7 dimensions and however many metrics you want. Which means that the danger of mixing in wrong level metrics and dimensions is significantly higher.
In fact, using the API is a great way to learn those differences because it really forces you to think about what metrics and dimensions you need for your analysis. And this page from the google developers documentation is the best place to get the definitions for almost all the metrics and dimensions in GA :
https://developers.google.com/analytics/devguides/reporting/core/dimsmets
Carmen
PS: Avinash, Time on Page and Time on Site have their purpose – to allow you to calculate avg time on page/site when pulling data via API and aggregating it with pivot tables. Didn’t get it until I migrated to using the API exclusively.
Pingback: Bruk ditt PLN for å lære om måling. | Steffen's Hjørne
I’ve made a recent discovery in Google Analytics that is closely related to the topic discussed here. GA inflates Goal Completions associated with a page (when that goal is an event/virtual pageview that captures a visitor interaction, ie click on a button). As a result, Page Value is also skewed. This makes Page Value inaccurate at best, misleading at worst. The symptom is if you have higher Goal Completions compared to Unique Pageviews for a page in your GA reports. Both should be calculated once per session.
The discussion is on Google+ https://plus.google.com/101413897062565650238/posts/Cmx8ELKEjWr
First of all, I would disagree with Avinash in that Page Value is designed to be a hit-level metric but its formula uses a session-level metric (Goal Completions). So it crosses the line between hit-level and session-level (which is also why it’s not available in the API, I suspect!).
It’s precisely how these Goals are assigned to the page that causes the faulty calculation (whether it’s a recent bug or it’s always been like that, I don’t know). According to GA, a page that is seen 3 times before a Goal is reached should get credit for the goal, but only once. I have carried out a controlled experiment which was corroborated by others and in reality the Page gets assigned 3 goals in this case. So you may have only 1 goal in that session but that page gets credit for 3 goals! and its Page Value metric is also 3 times what it should be.
So what is the solution Avinash? Disregard Page Value?
Great post Avinash.
Carmen,
It would seem I am having the same issue as you and would really like to hear Avinash’s thoughts on this. Is it because I am using session level metrics like conversion rate / goal completions with a hit level metric like page that the issue is arising or is there a bug? This screenshot shows the issue:
https://postimg.org/image/4ervl4n39/
Thanks
Josh I can’t see how your screenshot reflects the problem. The symptom is when goal completions for a specific goal (not for ALL goals) credited to a page exceed the unique pageviews for that page. Both metrics should be counted only once per session and only once at page level.
It’s such a difficult situation to spot because people often will look at total goal completions (for all goals they have set up) and the number will always exceed unique pageviews for a page if you have 2 or more goals set up (ie page A gets credit for goal 1 and goal 2 in a single session => 1 Unique pageview and 2 Goal Completions).
The issue I described is when the Goal Completions for a SPECIFIC goal exceed Unique Pageviews. Would be good if we could continue the discussion on Google+ and not hijack Avinash’s post any more than I already have ;-).
However, I still maintain my point of view that Page Value by its very definition mixes hit-level metrics with session-level metrics making it an exception to the otherwise excellent guidelines that Avinash has described here.
Helena: You should measure the job you are trying to get the page (trousers in this case) to do. So if the job the page is trying to do is get someone to download a design, measure that as success. If the job is the someone adds a pants to the cart, measure that.
Every page will do other minor jobs as well, say send people to the shirts pages. But you want success to focus on the main job you designed the page to do.
Avinash.
Pingback: Jak obejít sampling dat v Google Analytics | Optimics
Pingback: Google Analytics Implementation - Advanced segments and custom reports. Dashboards. (Part 9) - Google Analytics Notes
Hi Avinash,
Great article, really helpful!
I’ve been having some difficulties understanding why the pageviews on a given page change drastically when I add a dimension like source. Under Content, All Pages, page X has 4000 pageviews. When I get into that page and add a dimension, it shows 7000 pageviews. It’s quite a difference.
Pageviews always increase when I add a dimension. Is it because page is a hit level metric and source is session level?
Which pageview number is correct? The 4K or the 7K?
Thank you,
Costa
Avinash, just feel your posts at time get very verbose and hence hard to read. It looks like reading through a script. The format you choose is better suited for video so I would propose you start doing video posts and summarize the concepts in brief summary notes
Just my 2 cents, and no offence please
Hello Avinash, really great article
I have doubts about such use case:
If we have custom report with dimension Page and metric Transactions+Avg time on page, and add secondary dimension Page Depth. If we are looking for some clues to increase avg order value, is it possible that such report would represent pages and their depth that have influence on the decision making?
Thanks, ALex
Alex: Page and Time on Page are at a hit level. Transaction and Page Depth are at a session level.
So you can’t mix those two clusters.
If you want to judge the value of content, you can use Page, Time on Page and Page Value. Using Page Value you can also figure out new ideas to improve AOV.
-Avinash.
This is great!
I saw this graphic on your latest post and was like “what is this?” but it totally makes sense now.
(Side note: By the way, you’re great a getting users to dive deeper in posts.) I always wondered why certain dimensions and metrics showed up on the reports so now I know why.
Hi Avinash,
Thanks for a great post!
I have created a report based on the landing page for organic (not provided)-keywords measuring how conversion rate differs between landing pages. This is mixing session and hit, but I make an assumption about the set of keywords for each landing page, so in theory I am looking at this on a keyword-set (session) level.
Would you say that is an OK approach? :)
Thanks,
Johan
Johan: Landing page is a hit level dimension, conversion rate is a session level metric.
If you want to measure the value of a page, you can use Page Value. You can then apply your keyword level segment (or other segments) to that report. You will get the answers you are looking for.
-Avinash.
Pingback: Google Analytics API made easy - Google docs Magic Tutorial | distilled
Pingback: From visits to visitors | CRM & E-marketing
Mr. Kaushik, when you say “Conversion Rate (a dimension-level metric)”, you actually mean “a session-level metric”, right?
Hermes: Yes, of course you are right. Fixed! :)
Thanks.
Avinash.
Pingback: 4 People to Know if You're Trying to Get Into Digital Marketing - Tradical 360 Blog
Hi Avinash.
I am currently trying to implement your Digital Marketing and measurement Model to our website and have been reading your articles relentlessly over the past few weeks. Apart from occasional headaches, it has all been very helpful and pleasant (promise!).
I am quite stuck on creating my own reports though.
I am trying to create a report that answers the following question: “How many new visits have been caused or motivated by promotional events?”
In order to do this, I have linked (in my head) promotional events to pages that talk about those.
When creating my report, I chose to look at the metric “new visits” (since I want to know the number of people who found out about us thanks to our promotional events) and “visits” (because I also would like to know if my promotion is attracting people who already knew about us).
Now comes the hard bit: my dimension.
I am trying to only look at people who have been through certain pages relating to our promotions. In my dimension drilldown, I picked “pages” and then filtered my results by including the pages I consider relevant.
However, it feels like I am doing exactly what you forbid by using a session metric (new visits, visits) with a hit dimension (“pages”).
I was under the impression that my numbers would show me what I was after, that is: “The evolution of the number of New visits and visits for all people who went through the selected pages”.
Am I wrong in believing so?
If I am, how can I get the result I would love to obtain?
Thanks for your time and great work, as usual.
Ben: Let us unpack a couple different threads that are going on in your note.
First, it is quite fragile to believe that the new visits are only caused by promotional events (on those pages you promote at the event). At the minimum look for some strong correlations in traffic spikes. That will at least be a clue (even if not causal).
Here’s a blog post that might help: Excellent Analytics Tip #12: Unsuspected Correlations Are Sweet!
The cleanest way to do measure impact of promotional events is to give the attendees a vanity url. When you create the vanity url, encode it with campaign parameters (which the attendees don’t have to remember) and you have clean tracking (regardless of if they were new or returning visitors).
Ok, on to your last question…. One thing you could consider is to create a segment (in the new GA segmentation, a Filter) with the Condition Landing Page Contains (or matches etc) and the name of the pages. You can apply this segment to various reports.
Another simpler option is to create a custom report. Dimension: Landing Page. Metrics: Unique Pageviews, Pageviews, Per Visit Goal Value (or other hit level metrics). Filter: Include Landing Page Condition, your promoted pages.
This will give you a nice clean view of those pages performance.
Apply the New Visits segment to this report and you are in business (assuming all new visits are from your promotion).
Sounds ok?
-Avinash.
PS: If you need more help, hire a GACP to help you out. Here’s a list: http://www.bit.ly/gaac They are quite affordable and can help you do this cleanly.
Are transactions and revenue valid metrics for Landing Pages, Source/Mediums, or Countries/Territories?
Jeannie: Transactions and Revenue are both session level metrics, they go well with session level dimensions like Source/Medium and Countries/Territories.
Landing Page is a hit level dimension. The best metric for it will be Page Value.
-Avinash.
@Avinash
I’m having trouble understanding how Landing Page is a hit-level dimension.
My understanding was ‘Page’ is hit-level and ‘Landing Page’ is session-level.
When someone lands on the site, throughout the session, the landing page doesn’t change. If so, shouldn’t it be a session level dimension?
Shane: Landing page is a little tricky. Please see the section in the post titled “Exceptions to the Rule.” I talk about Bounce Rates there, similar challenges in that case we well.
If the Landing Page is the only page that a visitor sees, clearly it is a session level dimension. But if our beloved visitor stays, they engage with the site, then, I believe humbly, that we should treat it as a hit level dimension. One of many hits that come in to paint a picture of the session.
And of course, I would stress a lot more about what metrics I’m pairing up to measure success (don’t use Conversion Rate, if you buy what I’m saying above, and use Page Value instead).
-Avinash.
Please correct “A collection of hits from one visit to the site” to “A collection of hits one visit to the site”.
Don’t mean to nitpick, but for the convenience of amateurs like me :)
There was a typo in my previous comment:
Please correct “A collection of hits from one visit to the site” to “A collection of hits form one visit to the site”.
Don’t mean to nitpick, but for the convenience of amateurs like me :)
The difference between a hit an an event?
Is it more than semantics?
Dale: Not so much semantics, I believe.
Hit is a generic description.
An event is one type of hit that is collected by your web analytics platform.
Avinash.
Pingback: Get Complete Traffic And Conversion Insight With Google Analytics Custom Reports | Search Engine People | Toronto
Thanks Avinash for these insights.
Have gone through your post while learning Google Analytics Principles. You really hit the nail in terms of classification of data and how it should be looked at. My doubts on session and hit were answered to a great level though this has to be seen in practice.
GA should also implement some of these inputs in its reporting formats since with all this data people really need to have clear objectives to get the best output.
Pingback: daily 03/25/2014 | Cshonea's Blog
Hi Avinash, great post.
Similar to your example and many commentators, I’m trying to understand which type of content can be attributed (if even loosely) to various conversions. I’ve set up a number of hit-level custom dimensions on our blog posts that identify things like author, topic, etc.
GA is telling me that 0 conversions can be attributed to these hit-level metrics, which I now understand is because the conversion didn’t happen on that page, they happened a few hits down the line. Is the solution as simple as changing the scope of my custom dimensions to user-level (because I’d like to know if they converted even if they left and came back)? That seems totally counter-intuitive, because the custom dimensions are describing attributes of a particular page, not a session or a user!
Any (more) advice you could offer would (also) be very appreciated :)
Corey: I’m hesitant to provide an answer because I’m not sure what you have done on your site exactly, and I could just as easily provide imprecise guidance.
The best option for complex GA requests is to hire a GACP to go through the requirements and validate and recommend the right path. You’ll find a list here: http://www.bit.ly/gaac
-Avinash.
PS: The Page Value metric in GA essentially computes what you are looking for for each page view in a converting session. That should hold a small cluster of clues as to what the possible solutions could be. :)
When looking at the page views for a week, this number is smaller than the cumulative number of adding page views for each day of the week. Can you help me understand why?
In addition, when looking at an event action and then drilling down further into the event label, the total event action number gets smaller when drilling down to the event label. Any insight into why?
Help is much appreciated!
Nimurak: Sometimes the altitude you look at can cause this to happen, and the dimension used to aggregate the data up as you can imagine also causes this to be an issue.
It is difficult to share a definitive answer, I would encourage you to work with a GACP who can help you understand what is going on. You’ll find a list here: http://www.bit.ly/gaac
Ditto for the second question. When you drill down (or up) you are filtering the data and that can often cause this (and it is ok). A GACP look at your own data carefully and explain to you what is going on.
Avinash.
This is the 3rd time i’m reading this post and its excellent. Should read it again in a month or two :)
I’m having trouble wrapping my head around how to analyze some of these reports.
Take your source report as an example. What value do we get out of this report? I can see that twitter has the lowest per visit goal value. If I was the owner of this site, does this mean I should think of changing my twitter strategy to try and get that up?
Depending on my strategy maybe I expect it to be low. Let’s say I use twitter to share articles and get RSS subscribers that I value as $5.00. On the other hand I use Google Adwords to retarget my RSS readers to promote products that result in ecommerce transaction with much higher value resulting in a high per visit goal value. Does this mean twitter is performing poorly? Not necessarily.
This is why I have trouble finding actionable information in many reports.
Nelson: I actually think you are understanding the article and the report just fine. You are simply struggling with “what is the right thing to do for my business.”
It is a thing everyone struggles with.
The question you ask at the start is, why do you do Twitter? Why do you do Social Media? Maybe for your company it is irrelevant to make money. In that case, the report is showing that your strategy is working just fine.
Usually that is not the strategy. You want something out of the Social traffic. Even if you don’t want the conversion now, you want it later. In this case the report is showing you that you are getting some, it is for you to decide if it is enough. (This post might help: Best Social Media Metrics: Conversation, Amplification, Applause, Economic Value)
With regards to the second part of the comment… No, that does not mean Twitter is performing badly, it means your RSS re-targeting performs well to drive ecommerce.
Each channel has its purpose. If you know that purpose in advance, it make the interpretation of this report easy. If you don’t know the purpose of your marketing activity, it makes the interpretation harder.
If you don’t have a purpose, but would like to identify one please see this post on how to: Digital Marketing and Measurement Model
While nothing in life is easy, this is less hard than you might imagine.
-Avinash.
Maybe there is a TYPO when you write
“They are meant to only identify performance of the purpose box.”
and you wanted to write
They are meant to only identify performance of the PURPLE box. ?
I am the last arrived here in this huge world…and don’t want to be “arrogant” with this message… just hope to help.
Thanks
Gabriele
Gabriele: OMG! You are totally right. It should be purple and not purpose. :)
Thank you for letting me know. I’ve fixed it.
Please never consider it to be arrogant to help someone like me to correct mistakes. I’m grateful to you.
Avinash.
Avinash, thanks for tackling these issues that aren’t sexy or awesome but terribly important.
My reason for (re)reading this post is my current problem with a custom report which is reporting 138% bounce rates (theoretically impossible) because I think I’m mixing a Page-level custom dimension with Session Level metrics (bounce rate).
However in this post you describe bounce rate as a page level metric? If it is a session level metric like I’ve always assumed (from google documentation: “Bounce Rate is the percentage of single-page sessions…”) could it explain the wild bounce rate?
I’m not even sure that does – because if I look at the raw number of sessions and the raw number of bounces – there are more bounces than sessions! Perhaps the implementation needs checking again. But for the purposes of not mixing page/session level dimensions and metrics – is bounce rate a page level metric or a session level metric?
Thanks!
Ed
Ed: Bounce Rate is computed for the session. But it is optimal to be thought about as a hit level metric (page level).
From what you’ve described it looks like there might be a data issue. It is unclear if it is in the data capture or data reporting. If you need to dig a bit deeper and need help, please leverage a GACP, they are quite affordable: http://www.bit.ly/gaac
Avinash.
Excellent post!
So happy to find this one, otherwise I would keep going with the “silent death”… :)
You mentioned that “An individual page does not deliver Goals and Conversions”. What if the website I am trying to track is a closed system with specific tasks that count as conversions on individual pages (a back- end for users to control their assets on the front – end), what will be the best way to track those individual tasks as goals?
Thanks!
Nahum: It is not clear what your site does, if you want more specific advice please consider working with a GACP who can look into your specific needs and help you figure out the best solution/answer.
From a macro perspective, my context for that statement was that each page should be held accountable for it is supposed to do, rather than overall end goal that might be two or ten or twenty pages down. In some cases, say a checkout experience, there might be a different way to think about this. But overall, just hold the page accountable for the job you created it for! : )
Avinash.
Pingback: Understanding users, sessions and pageviews | Web Analytics and Measurement
Great article. What happens if you are using a visit level dimension and metric such as country and session but filtering at a hit level such as page.
If you use hit level dimensions in filters, should you also stick to hit level metrics.
Thanks,
J
Jonathan: You will get results for your query, but they will be funny. Actually, that’s not right, they will be imprecise results. :)
If you think about it for a moment, hit level metrics don’t really have session (visit) level associations and hence the issue.
It is optimal to stick to the optimal level (person, session, hit).
Avinash.
Thanks for the reply, sometimes content makers want to know how many users and sessions a group of pages has got and I can only filter by page or hit level custom dimension.
I will have to just stick to giving pageviews only!
Hi Avinash,
First of all I want to thank you very much for your informative articles. As a junior analyst I learn a lot from your impressive posts. I do understand the difference between the session and the hit level. It is well explained in your post.
I have a problem with the segmentation and the visitor level. I created a custom segment on a visitor level which only regards visitors who entered the site at a special landing page.
With that segment I segmented the “All Sites” report, so the following results were shown:
(Segment: Landing Page = XY / Visitor-Level)
Site Pageviews
/success
All Sessions 123
Landing Page XY 20
So Visitor Level (Custom Segment) is here combined with Hit-Level (Pageview).
But I can’t find a reason why this should be invalid. What do you mean?
Thank you very much and I hope to read more impressive posts from you!
Milan: Without looking at your segment and report it is very hard to give you a precise answer. Your best option is to work with a GACP who can actually log into your account and help in a very precise way. Here’s a list: http://www.bit.ly/gaac
In general…. Landing page is hit, but it is unique in that there is only one per session and so we can consider it to be a session level dimension. So if you are going to create a segment for people who enter on a certain page, you should use Visits (or Sessions as GA calls it now), and not Visitors (or Users as GA calls it).
You should then be able to apply it to the Channels report or Source/Medium or Referrals and you would be proceeding in a logical manner.
I’m afraid I’m not sure as to what the rest of the note is about, but a consultant who can work with you can assist.
Avinash.
Good post.
I still can’t understand how google Analytics is putting by default (even suggesting) CR% on their Experiment panel.
Comparing multiple versions of a page cannot be analyzed pertinently with CR%.
Charly: Some people in the testing and optimization business believe that measuring conversion rate for a page is a good idea (and also other cooler things like Page Value were not available to them), hence you continue to see this.
For Landing Pages, there is some gray area, you could possibly say you can use CR. But definitely not for the others, and I have to admit, even for the Landing Pages I do not believe it is a good idea.
Avinash.
Hi Avinash,
Thanks for the post! I’m a new user of GA.
Please let me know if we need to identify funnel drop offs (Funnel Page level) which metrics we should look at?
Antos: You can use Page Exit Rate. It is the only place in the entire ecosystem for Web Analytics that it is ok to use that metric (ever other place it is a complete waste of oxygen).
I call it Abandonment Rate, how many people abandon at each page, but it is the same thing.
Avinash.
Hey,
I was wondering if you can combine page title with users in order to see how many users visited that page. Does that violate the dimension and metric scope combination?
Thanks!
Phil: Pages are hit level metrics, Users are people level and Visits are session level. Just to get that out of the way.
There is a simple way to do what you are requesting. If you go to the All Pages report in Site Content in the Behavior folder, you’ll see that the first two metrics are Pageviews and Unique Pageviews.
Pageviews is total number of views of that page (so if one person saw that page 10 times in visit you’ll see 10 here). Unique Pageviews is the count of how many unique visitors saw that page (in our earlier example, this would show 1).
So just use Unique Pageviews for your page titles and you are in business!
Avinash.
Pingback: Zimri Mayfield | How to pass the Google Analytics IQ Exam in 2015
Hi Avinash!
You’re right to insist on that point, great post :)
Nevertheless, I guess that landing page is a hit level metric, but it’s also where the session started, as for search keywords. So it doesn’t seem silly to check the e-commerce conversion rate or per session value of sessions that started on a particular page. Or is it?
Plus, for instance, to know wether visitors performing a certain action (like watching a video) convert more than others, we would have to look at session based metrics (goal conversion rate) for a hit level dimension (events). How else would you do?
Buzut: Landing page is a hit level dimension. But, since there can only be one such hit in any session, it can also be thought of as a session level dimension.
Let me be clear that a case can be made for using ecommerce conversion rate to measure landing pages. Given that a conversion is usually 5 to 25 pages away from the landing page, I do not recommend using conversion rate. Just use Page Value. It is what you are trying to get to any way.
For your second question… You can use the Unique Events metric which only measures an event once in a session, and then you can see if it has an impact on conversion.
-Avinash.
Thanks for making this clear!
Pingback: Lies, damned lies, and aggregated statistics. Google Analytics Overview reports explained including why you shouldn’t use them | Web Analytics and Measurement
Hi Avinash,
I keep coming back to this article over and over again!
One thing that is bothering me currently: I want to find the number of sessions in which every page of the session contains /blog/ in the url. I’ve created a customer report with a filter that says to include only Pages (dimension ‘Page’) that contain regex /blog/, and I thought that this would be fine.
But when I check the Exit Page for these sessions, some of them do not include /blog/. So this means that my custom report did not work well. Because if it did, then all pages – including exit ones – should have /blog/ inside.
I am assuming this might be related to the hit/session level discussion, but then I just don’t know how to get what I am looking for.
Thanks!
Ivana: Is Exit Page the drill-down in your custom report? Or, have you created a custom segment with the Page dimension and /Blog/ filter and then applying it to the Exit Pages report?
It could very well be a hit/session issue, but I’m not quite sure what you are doing here. :)
Perhaps you can share more details or the custom report you created.
Avinash.
This article is really great and it helped me understand those issues much more deeply, however is the potential for mistakes is still relevant?
By looking at the customized reports Google Analytics Oct 2015 , it seems that except some very few metrics (like loading time of a page), all other metrics in a session level do fit a session level and not a hit level.
Am I wrong?
Pingback: 11 Harsh Truths: Why Your Hotel Digital Marketing Isn't Working - Part 2
Hi, what a great website with lot’s of actionable content. I subscribed. Thank you!
For my question, I came across info about using pivot tables, but just to make sure I understand what you are saying here, in this example, the metrics that should have been used are pageviews and page value, instead of the visits and revenue?
Right now the dimensions are hits and metrics are session based, which is not correct, right?
I hope I understood correctly and hope to hear from you.
I am sorry, I forgot to include a link to the example in the comment I made a couple of minutes ago. It’s: https://www.annielytics.com/blog/analytics/how-to-create-pivot-table-friendly-custom-reports-in-google-analytics/
Mark: For landing pages, it is always a bit odd. While they are a hit level dimension, some people consider it to be a session level as well because there can only be one landing page per session. There is some merit to this.
Keyword on the other hand cannot be considered a hit level dimension, it is definitely session level.
In the report you mentioned, the right metrics to use are indeed Pageviews (or Unique Pageviews) and Page Value.
Finally… I do not believe that any single page should be held to Revenue outcomes. That is an imprecise metric. Pages are responsible for getting people to the next page. Hence, the best metric is Page Value.
Hope this helps.
Avinash.
Hi Avinash,
What a fast reply! Thank you!
I am glad that I understood what you have thought. Very insightfull articles of great value. You got a new loyal reader!
As I was reading your articles about goal conversion rate/value and events, I was wondering. Since most events are hits (click on a specific element / image / link on that page…) is the event value that is set up (I do it via Google Tag manager) also included in the page value for that page, if the event happened on that page? Say you have measured the economical value of a specific click on a page at usd 0,05. Is that added to the metric page value?
I’m sorry, I hope you understand what I am trying to say. I’m struggling to find the right words…
Mark: There might be some confusion. Event Value refers to a value (not monetry) that you pass back to GA. For example, video viewed up to 30 seconds.
You can use Events as Goals, that is where you will set Goal Value (for that event). Then, it gets used in the Page Value computation.
Avinash.
I know that for video’s etc. you could use it like that. And is meant for that.
I will explain in a bit more detail what I mean. I am completely new to GA + Google Tag manager, except for the last two weeks where I invested more than 30+ hours per week of reading, reading, watching video’s, doing some more research etc.
After doing that, I came to this conclusion so I can measure each visitor behavior in completed behavior and value for that behavior. I get dive deeper later on with segmenting.
So, to get the data I want, I have set up events like micro conversions. All little steps that help lead up to a macro conversion, which for me is only 1: a sale.
All other events I treat as micro conversions that are steps to help in an eventual new or repeat macro conversion. But each micro conversion has a different value, depending how important the action taken in in relation to a potential macro conversion. F.e.:
– submit a customer review
– submit a product review
– submit a reaction on a blog post
– subscribe to a newsletter
– session duration > 5 minutes or total pages viewed > 5
– add a product to the cart
– remove a product from the cart (because that could also mean they chose an upsell or at least means they are in the buying mindset that can and should lead up to a sale)
– share content on various social media sites
etc. etc.
I value each micro conversion, based upon a certain percentage of the average value of a macro conversion. For each micro conversion I then assign that value to the event value set up in Google Tag manager. That value gets passed to a goal set up in GA.
So what I mean is this. When looking at the column ‘page value’ in GA, is the page value only the sum of transaction values for the page if that page assisted in a ecommerce transaction, or is it the total of that PLUS the sum of all the little micro conversions values for that page, set in the event value? (again… event = used as goal??)
Hope this makes sense…
Great post and detailed information. The specific guidance will help me action your recommendations quickly.
Thank you for sharing!
Hello Avinash,
Another awesome post – thank you!
I am wondering – if a user visits your site via a paid channel (paid search for example) and then later visits your site again, in a different session, either by directly entering your URL in the address bar or via organic search, which channel would get the attribution?
Thank you Avinash and all the best,
Varun
Varun: Two quick things.
1. In the standard Google Analytics reports… the last ‘defined touchpoint’ will get credit. The only exception to this is, if the last defined touchpoint it direct – in which case the one prior will get credit. So, if it is Organic > Email, Email gets credit. If it is Organic > Email > Direct, Email gets credit.
2. It is recommended that you use the Multi-Channel Funnel reports in Google Analytics. In those reports, whatever is the last touchpoint – even if it is Direct.
There is more on this topic here: Multi-Channel Attribution Modeling: The Good, Bad and Ugly Models
Avinash.
Thank you for your response, Avinash. And for the multi-channel attribution modeling post link :)
A small follow up if I may – it is my understanding that multi-channel funnel reports only take in to account users who have converted. If I need to see the sources/channels of my entire user base, would creating a segment for each medium/default channel grouping suffice (and return accurate numbers)?
Thank you once again, Avinash… have a great week!
Varun
Varun: MCF reports will show the “journey” that leads to a conversion – macro or micro.
It would hence include an e-commerce outcome or a goal you’ve set up (from the 6 different options in GA).
If there is no outcome, I’m not sure what you are looking for. What the purpose would be. But. You can work with a GACP who can look into your specific scenario and give you specific consulting. You’ll find a list here: http://www.bit.ly/gaac
Avinash.
Thank you, Avinash! Your insight is very much appreciated :)
An excellent post. Thank you (again), Avinash! You have a way of explaining things that make it seem so simple. I have been trying to explain things like the examples you’ve cited above but have never been able to get my point across. Thanks to this post, I know I’ll be able to win the argument and hence, get our company dashboards finally changed. It’s difficult to argue when the data ‘looks’ right to the untrained eye.
I’ve been reading your blog for years now. I once asked you in the comments how I could make the switch from marketing manager to web analyst, and you gave me some tips back then and linked me to one of your posts which details exactly how to do that. Whilst I am still in the marketing manager position, I’m a lot more involved with web analytics and I’m still hoping to make the full switch one day. Also, thanks to me putting into practice what I learn here, I am now in the position where I am able to offer basic level GA training at my company (not in an official capacity). I’m also very near to taking my GAIQ :-) Thanks for giving me the confidence to pursue what I love in my career!
Pingback: Cohort Analysis in the “Real” World: An Utterly Fictional Case Study in How to Assess Customer Purchase Behavior | half whit
Pingback: The Google Analytics Add-On for Sheets: An Intro to an Underutilized Tool
Pingback: The Google Analytics Add-On for Sheets: An Intro to an Underutilized Tool | MarketingTumbler.com
Hi Avinash,
You said: “Another example, it is imprecise to look at Pages (a hit) and measure Conversion Rate (a session-level metric) for it.”
What if I have pages (say any particular category pages of an e-commerce website), and I want to measure the conversion rate of such pages.
I can create a funnel from such pages to a virtual page that is fired when the lead is made.
In this way, the funnel conversion rate is the conversion rate for such category pages?
Anything wrong with this approach?
Yuvraj: Still you’ll have the same problem.
Just measure the wonderful metric called Page Value. It is helping you measure exactly what you want, without the logical problems of using Conversion Rate.
If the page is in a funnel, use Abandonment Rate. Nice and clean metric. (How can you measure Conversion Rate of Enter Credit Card page? It might not be logical.)
Avinash.
Hi Avinash,
Thanks a lot for replying. My apologies, I made a wrong example for the conversion rate of e-commerce payment page.
My site is a used car classified site. This site has 2 main pages where people can drop their lead (name,email, phone number)
1> Search result page ( SERP where user can see a list of used cars)
2> A used car detail page (where user can see details of the car)
Both pages have a template and call to action button to submit lead against each car listing.
My point is that I need to improve the conversion rate of SERP and detail page.
My Aim – I want to measure and improve conversion rate (percentage of sessions on these pages that result into a lead) of SERP and detail page.
My Method:
1> Since both car SERP and car detail page have same template for different make model cars, I have applied regex on the 2 pages and fired virtual pages as soon as a user visits this page.
2>Next I have created a funnel – 1>Virtual page fired on SERP -> Lead form filled 2> Virtual page fired on detail page -> Lead form filled
Step 2 gives my funnel conversion percentage for both type of pages – This is the metric I am using to improve the page conversion rate (% of people filling the form)
Is this method fine?
Thanks a lot!
Awaiting your reply
Thank you very much for posting this article! I am learning quite a bit from your posts but was hoping to just get some guidance related to a certain project I am working on in GA.
Is there any way to obtain sessions by day for sessions that see two distinct pages during one session? Essentially I am looking for the number of sessions by day that reach both the search results page and a detail page within a session. I initially had an advanced segment and custom report created but now I am thinking that this might not be providing correct numbers. Is there any work-around you can suggest?
Thanks!
Pingback: Dimensioni e Metriche: il problema del mancato allineamento.
Pingback: When is a Session not a Session?
Pingback: When Is A Session Not A Session? | Peel World
Avinash,
Is a goal conversion metric incorrectly counted in aggregate when including a hit level dimension such as pageTitle?
Given query limits, it might seem convenient to query a dataset that, for example, tracks users over time who were referred to your site through a particular campaign on a particular date with a page title dimension and goal conversion metric. This way you could see the composition of pages visited by these users as well as calculate the total goal completions attributable to users referred through the campaign (with the knowledge that this data should not be used to analyse individual goal completions). Would the total goal completions be inaccurate in this data?
Thanks,
Cole
Cole: Conversion rate is a session level metric and Page Title is hit-level dimension, hence I’m afraid we can’t mix those together.
If you want to know the importance of pages across sessions, Page Value will give you what you are looking for with your comment.
Avinash.
Avinash: Thanks. Where can I learn how the goal completion is aggregated across the dimension and why the numbers are wrong in this case? Everyone states kind of top level reasons why it’s wrong but I haven’t found an in-depth explanation of why the way GA calculates the sessions level metric across the hit-level dimension is wrong (even in total).
Cole
Pingback: The Google Analytics Add-On for Sheets: An Intro to an Underutilized Tool
Pingback: When is a Session not a Session?
Lovely post.
Took me back to basics, and helped my thought process.
Thank you.
Pingback: Metrics and dimensions that can be used together in Google Analytics - martin.boros.sk
Hi Avinash,
Thank you for a brilliant post, I’m an avid reader :)
I have a bit of a problem – my employer wants to know how (and if) a specific page – an inspiration page – on our site affects the total sales of visitors to the website. My solution so far has been to make a segment with the sessions containing any visits to this page, and see how this compares to visits not containing visits to this particular page.
However, after reading this post of yours I’m starting to think that this might be the wrong way to go about it, as it would measure both metrics related to hits and metrics related to sessions.
So right now I’m a bit confused :)
Would you have any suggestions on how to measure this in a correct way?
Anna: There is a metric that will help you measure exactly what your boss wants: Page Value.
Just use it. :)
~ How Page Value is calculated.
-Avinash.
Pingback: A Beginner’s Guide to Organic Traffic Audience Segmentation with Google Analytics
Thank you Avinash for this GREAT read.
I laughed at your rant (which is such a welcome relief from all this G.A. studying..) !
Thanks for all the value you’re sharing.
Is there no cheat-sheet that clearly shows the scope of all metrics and dimensions? The ”
Dimensions & Metrics Explorer” https://developers.google.com/analytics/devguides/reporting/core/dimsmets is supposed to deliver on that but I don’t see how. Selecting e.g. “Pageview” (hit) leaves Sessions (session) untouched.
Hey Avinash, I have a question pertaining Dimensions and Metrics. As we know, certain dimensions can only be paired with certain metrics (else the data would be all meaningless…for exa: hit level with hit level).
If we have a floodlight tag firing for certain pages on a site, and we use both Google Analytics and Adobe Analytics, how would we validate it? For example, is it logical to compare DCM conversions with sessions (google analytics) and visits (Adobe Analytics). Since Page is a hit level dimension, wouldnt it make more sense to use “pageviews” instead.
In short, I am trying to understand the right dimension-metric pairs for Custom reports (not the ones listed on https://developers.google.com/analytics/devguides/reporting/core/dimsmets
Could you please throw some light on this?
Shashank: Comparing Adobe and GA in a reconciliation quest is only of minor value I’m afraid.
Here’s a post that might be of value: The Ultimate Web Analytics Data Reconciliation Checklist https://www.kaushik.net/avinash/ultimate-web-analytics-data-reconciliation-checklist/
As to how to match dimensions/hits between the two tools, your best strategy is to hire an authorized consultant for both companies (there are many out there) who can help you. Here’s a list: http://www.bit.ly/gaac
Avinash.
Great post, which I have returned to quite a few times. I still wonder about “Next page” reports though. As I regards these primarily as page level analyses, I think they should contain Page views, not Visits. And indeed this is what Google analytics, Webtrekk and other suites use.
However, could you also use Visits after all? Is this a grey area?
The report shows how many times pages A, B, C, etc. were viewed after page X. When you use Visits, would it means it shows in how many visits these page were viewed after page X? Or do data not make sense in this case?
David: I’m not sure I understand your comment well enough to respond. Were you speaking about a particular report in this post? Something you were trying to create?
Macro point. If you are measuring pages the ideal metric is Views (for all views) and Unique Page Views (counting each page just once in a session even if it was visited multiple times).
Avinash.
Pingback: Automatiseer je test analyse (Google Analytics) - Webanalisten.nl
Hi Avinash,
Great article as always. I am a recent convert from Adobe Analytics and am having trouble with this concept.
On our website we a member can have two accounts and therefore can switch between “member types” within the same session (infrequently). Member Type is captured on all pages post login and therefore allows us the ability to use either a hit or session scoped custom dimensions.
If we use sessions scope:
Pros: Allows us to bring sessions into the report
Cons: Will not capture the switching of user accounts because it only keeps the last value
If we use hit scope
Pros: Will capture the switching of accounts
Cons: Will not allow you to bring in sessions.
It would greatly help to have your perspective on how to think about this. It seems to us like there is no perfect solution for these scenarios. In Adobe a custom dimension would persist and capture all hits would be assigned until overwritten by another dimension value. In google it seems to only allow one custom dimension value in a sessions.
Thank you,
Brian
Brian: I’ve often had a lot of luck working with GACPs who can figure out something creative. If you want to go down that path, here’s a list: http://www.bit.ly/gaac
You’ve captured the pros and cons well. Of sessions switches happen infrequently, the trade-off in my mind, outside looking in, is simple: You focus on getting 98% of the data! :) Most value will likely come from analyzing non-members and members. You lose a small nuance for members who switch it might have little incremental value (though reach out to a GACP).
Avinash.
HI Avinash,
Thanks for posting this information – its nice to have trustworthy resources to help you along the path.
Question – Why does enhanced ecommerce measure transactions by using session level data? Why not use user or Unique user data for transaction rate calculations?
Scott: It is simply a function of most part of GA being based on session level metrics (except of course the multi channel funnels folder reports).
Over time I’m sure this will change.
Avinash.
Pingback: [eCommerce Customer Segmentation] Bracketed Segmentation: Peeling Away The Layers - IE.GUIDE
Can’t believe this post is 7 years old and I just came across it searching on Google for a answer to a CURRENT query on tagging!