 The art of analysis often fails to deliver ginarmous success simply because of how limited our worldview is when we go about identifying bottom-line impacting insights.
Hence, this is a post on a simple concept that will drag you out of your current "what is happening on my website?" comfort zone, and out of your Google Analytics, Site Catalyst, WebTrends worldview silo.
Sounds like fun?
It is. And you end up becoming rich and famous. Not too shabby, right?
Macro Business Context: The Big Deal
Digital is an obsession for almost everyone who reads this blog. Part of the reason is that even if you work for a multi-channel company you are likely in the "web," "interactive," "internet," or "digital" division. That narrows your responsibilities, and in turn your worldview. Part of the reason is that the data you to which you have access narrows your worldview – "Hey, all I have is Google Analytics, so all I'll look at is Google Analytics data!"
Somewhere inside us we know that there is more to our business than digital; we are not stupid. But the two reasons above combine to narrow our focus. This does not mean you'll cause a huge disaster for your company. No. But it is very likely that you are not going to have the hugest possible impact. Your company will be, at best, just as good as others (since people at other companies also have conveniently narrow world views).
I don't like that.
We should shoot for the stars! We should shoot for magnificent glory!
Let's try to do that today with a very simple story, one that I hope will have much broader implications on your digital success measurement.
Macro Business Context: The Challenge
I was working with a company that runs a private college type system. Let's call them ZQI University.
At ZQI U, a vast number of students enroll into online-only courses (just like our analytics, PPC, mobile, and SEO Master Certification students at my awesome Market Motive). But ZQI U also has many real world campuses, so students can enroll online and attend in the real world.
Digital advertising and marketing is a key part of ZQI's multi-channel acquisition portfolio. They do everything.

The cloud above is a rough to-scale approximation of their current traffic sources. As is common in these types of educational companies, aggregators rule the roost. They are simply much better and way more aggressive than the educational companies themselves. They are also a lot less weighed down by legacy mental models than the educational companies, which enables them to think smarter and move faster.
So if you are ZQI, how should you measure success? How should you decide which one of these acquisition sources you should invest in more? How do you decide which one delivers higher value to the business?
Business As Usual
The answer to those questions might seem obvious.
Tell me how many people came to my website. Tell me how many of those converted into leads.
Well, that is quite easy. Just crack open your funnel in WebTrends, or the analytics tool you temporarily call your BFF.

Now that you have the macro view (don't expect your lead generation/conversion rate to look that good!), how can you figure out which acquisition channel is more important?
Again, easey peasey.
Apply advanced acquisition segments to your data, press a button here and press a button there and … boom!
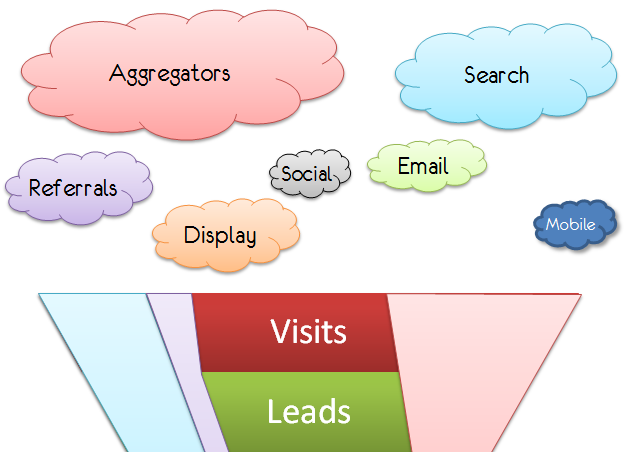
The above image only illustrates three segments and their conversions – search, referrals, and aggregators – purely for the sake for simplicity.
Back to the question, where should we invest more / which source is the best one for our business? Which fire should we add more fuel to?
The answer is simple: Aggregators.
They are the best drivers of traffic, they are the best generators of leads. Let's go find more aggregators / increase the bounty / be more aggressive in another way to get them to promote ZQI University.
And that is where we normally stop. I'd be lying if I did not also say that at this point we also expect a pat on the back / bonus / promotion.
The Fly in the Ointment
The challenge, of course, is that getting leads adds zero value to the business. As digital practitioners, we forget that blunt truth. In this case some value comes only if the student completes an application.
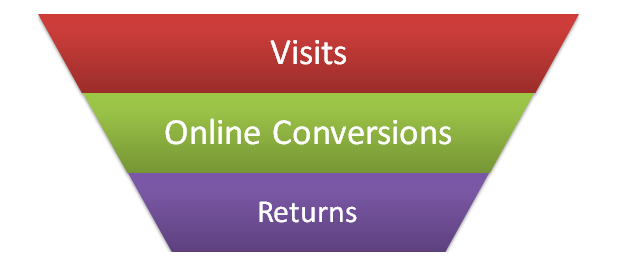
So Site Catalyst is essentially showing you a limited funnel if all you look at is the above picture.
Even if you are the digital analyst you need to at the very minimum look at this funnel …

At the moment you don't look at the third step for a very simple reason. That data is not in Google Analytics. It is in some ERP/CRM/Backend system inside your company. And you don't have access to it.
Go hit someone up. With a chat if that works. With a Facebook poke if that works. With a lovely smile if that works. With a threatening glare if you are good at that sort of a thing.
Because you need to know if you your earlier answer, that you should be pumping your precious marketing dollars to Aggregators, is the right answer.
Resist the instinct to go to the CFO with a massively parallel processed big data warehouse monkey dance business lack of intelligence tool to comprehensively measure everything and God.
It will take too long. It will cost too much. It will never have ROA (return on analytics).
You CFO might also laugh at you and shoo you out of her office.
Just get a quick dump of the completed applications into Excel. Join that data with your Site Catalyst / WebTrends data with the lead_id as your primary key.
Now apply your original segments to the funnel, and boom!

OMG! OMG! OMG!
What happened to all those "valuable" leads from Aggregators? And your "analyst expert" recommendation was to invest more in Aggregators. Ouch. : )
That tiny sliver of traffic from Referrals is not looking so bad now, is it?
And just look at all that Search traffic from Bing!
Now, what's your recommendation to the business?
Different, right?
That is what I mean by measuring real end-to-end success, about obsessing about real business profitability.
Forget Digital Conversions, Obsess About Real Business Profitability
Wait, wait, wait. Simmer down. I know. I know what you are going to say, you smart, awesome person that you are.
I do know that real business profitability for ZQI U does not come from the number of successful applications submitted.
Here's the rest of the funnel that takes us down to the actual point of real business profitability:

We only make the maximum amount of money as a business, after the student completes the course.
If they submit the application and are accepted, but don't enroll in the course, we don't make money.
If they enroll in the course but don't start the course, we don't make much money (maybe some cancellation fees, but come on, that is a pathetic revenue source).
If they start the course but don't complete it, we've not made the *complete* amount of money,
So when you head out to measure the success of your digital advertising and marketing, you need to know the conversion rate at step six, not just step two. Yes, in Google Analytics you can only see step two. Yes, you will have to wait for step six to be completed and it does take time – how do you feed the "real time optimization" monster (just remember, in real time if you optimize garbage, you still have garbage)?
For tactical optimization, maybe you can use step five as your success point (# of students that Started the course / # of Visits to the site). But when it comes to strategic media (ad/marketing) budget optimization, you need to look at step six (Completions).
And how do you know where to invest your ad dollars? Here you go…

Aggregators send 40% of the traffic to your site. A lot of that traffic also submits leads that go to your normal sales process. But when it comes to the quality of students that aggregators send to ZQI U, the students that successfully complete the course (hurray for them!) and deliver real business profitability to us, aggregators fall short. Way short.
ZQI should be obsessing incessantly about Referral traffic. Even if it looks like a small referrer, we can see it delivers a good chunk of ultimate profitability. ZQI should obsess about Search because it delivers 40% of the ultimate business profitability, from just 20% of the site traffic.
This is how business practitioners become worthy of a ticker tape parade in downtown:
By not focusing on just the digital data. By not focusing on just the digital conversions. By not even focusing on false prophets masquerading as real offline conversions. But by focusing on the ultimate business point of profitability.
Here's a simple picture to illustrate the key concepts. On the left the area where the engagement happens, on the right the amount of profitability accrued to your business.

Explains so much about why so often digital analysts are not taken seriously, right? If you stop at the point where the company has made no money, why should you be taken seriously?
Let me repeat, you can do this using a massively parallel processed big data warehouse monkey dance business lack of intelligence tool to comprehensively measure everything and God. That would be almost a perfect boondoggle for digital analytics consulting companies, or your internal IT teams.
But you don't have to.
It is manual, hard and not long-term sustainable, but you can get by with Excel (and my pretty conversion of the Excel data into the above PowerPoint picture!) for a while. You can earn trust, credibility and impact the business. Then you can go on your boondoggle. That would be ok, and perhaps even necessary as you scale.
And what metric should you focus on in this proper end-to-end view?
You can take any number of complicated paths. I try to keep things as simple as possible (Occam's Razor!).

Start simply by measuring the abandonment rate of each step in the process. Where's the leakage? Prioritize fixes.
Even with this simple view you can quickly identify where there are overall issues, or just for particular segments. It helps bring focus, it helps identify actions that add business value.
The mental model is simple. It might be a little difficult to get abandonment rates at each steps, you might have to deal with people, process, politics. But, as advised earlier in the post, you start with aggregate data for just these segments, you might find smoother sailing. You can complicate things later.
Remember, the quest is simple. We are not going to accept stopping at where our job responsibility stops (digital). We are not going to accept stopping where our web analytics data stops. We are going all the way to the real point of business profitability!
Identify the Real Business Profitability Point: E-commerce
We've used a university to illustrate the incredible value of going all the way down to the real business point of profitability. But you can go through this process for any type of digital entity (for profit, non-profit).
Let's take an e-commerce company. It could be a pure-play (Amazon, Shopbop), or multi-channel (Macy's, Wal-Mart).
Typically, we measure success by analyzing where people come from, and how many of those place an order online. That is not bad. But we can make a very simple extension to our analytical/success view and look at returns as well.
This makes us smarter in how we judge success. For example, Google could send you a ton of traffic via your pay-per-click campaigns. A bunch of them could also convert. But if the return rate for the orders is 10%, you may wipe out your entire profitability.
Now compare returns rate for Facebook and AOL and Email and … on and on.
You just have to stretch the time horizon you are looking at a bit more (look at the data 30 days after the order was fulfilled, typically the window for returns). And you have to stretch your data sources and not be limited by Adobe Analytics or whatever else you have.
If you want to be slightly more awesome (admit it, that sounds so tempting!), focus not on what happens 30 days after but rather what happens over a longer time horizon. Say three to six months after the original customer was acquired.
Your "funnel" would look like this …

Awesome, right? Now you are getting into the yummy customer lifetime value territory. You are getting in the delicious quality of customer territory.
From here you can go into online purchases and offline purchases (if you are omni-channel) and so much more.
And it all starts with a desire not to be limited by what your digital analytics solution can offer, and not to wait for God's perfect single source of all company data to come into existence five years from now, fifteen million dollars over budget.
Identify the Real Business Profitability Point: B2B.
What if you don't sell anything online? What if you don't sell anything to customers? What if almost all of influencing and conversions happen offline via a complicated process of meetings, dinners, RFPs and complex negotiations with multiple organizations?
You can still use the same mental model to identify the real point of business profitability and measure the success of your digital activity.
Let's say you are a company that belongs to one of my absolute favorite B2B entities, Danaher Corporation.
For each company in the Danaher portfolio, we could use the process outlined above to identify the real point of business profitability and identify the success of the company's investment in Google or Yahoo! or other digital channels …

The specific description of each step will be a little different for each Danaher portfolio company. But going through this process will ensure that the next time Mr. Larry Culp asks a company what is digital doing for their business, the question will be infinitely easier to answer.
This is not easy work, especially in B2B companies. The muscle you need to pull this off has not been exercised for a while, if ever. But we simply don't have a choice. If we don't do this, digital will remain an afterthought, companies will not take full advantage of all the incredible possibilities the digital revolution offers, and they might even suffer in the medium to long term.
But when we do it, the aforementioned awesomeness follows.
So if you are a B2C, B2B, A2Z, company, if you sell everything digitally or non-digitally, if you sell underwear or tires or services or software or just people, obsess about identifying the real point of business profitability. Quantify how your digital efforts are delivering against that point.
Go, knock 'em dead!
Ok, as always, it is your turn now.
How far does your company go in tying effectiveness of online advertising to business profitability? What is your biggest challenge in trying to go beyond the limits of data in your web analytics platforms? Do you have success stories to share about following this process and winning? Speaking of the process, what's missing from the above picture? What can I do to improve it?
I would love to have your ideas, war stories, guidance, and suggestions for improvements.
Thank you.


 Via
Via 


An awesome post and hits the nail on the head. Interestingly this fits our business model as well :). I think that the reporting channel wise funnel is very important. We have gone through this journey of no reporting to channel wise complete funnel reporting and I can say that this has opened eyes for us (Using UTM Codes even in our email campaigns to track individual people)!
A couple of things that make this difficult to implement (Specially in Education Business):
– The user generally does not buy the product on the first visit (It is hardly an impulsive buy). So it is difficult to completely attribute a sales to a single channel (They might have initially landed through SEO, but might eventually buy through SEM). So difficult to say where you should invest more!
– The reporting can wrongly attribute sales. Thus setting incentive structure for lead generation team (Till the point of form fill) becomes difficult. Without real incentives it is always difficult to keep the teams motivated.
– There is a sales cycle and it takes time from the user landing to the user buying. This duration again makes tracking the funnel difficult
– Requirement for help from CTO/ Tech team. As Avinash pointed out, generally till lead generation, you can use GA. Post that it is your custom database/ CRM. You can use Excel lookups (or Index – Match)… but they are tedious and each time you want to get the report it is a massive exercise (Assuming you have 5 channels, you need to get the report for each of these channels!). So practically you need to have databases and then write SQL to get the reports.
Just a few of my observations!
Paramdeep: I've spoken a lot about the merits of ensuring you are measuring every digital touch point in the consumer journey to conversion (on or offline). In this case I wanted to have clean focus on just the outcome, and how to identify value. With optimal multi-channel attribution or (even better) media mix modeling you can identify the optimal mix of "clouds" (above picture that drive the ultimate point of profitability.
With Attribution Modeling Tool built into tools like Google Analytics for free (or in other paid tools as well) this process becomes much easier to execute at a tactical level. But it is important to realize the flaw of measuring the wrong success still remains. We still need to do everything recommended in this post, or GIGO! :)
I concur with your last point, manual takes effort. But initially I would recommend exactly that because even with 90% accuracy you will make a ton of progress very quickly. Once you prove that this works, you can kick off an automation process (which might take two years, but until then at least we have a manual way).
Thank you so very much for sharing your valuable insights!
Avinash.
@Avinash: Thanks.
Actually we have been running SQL Queries (which is almost like the Excel lookups but done directly on the database) to generate reports. This is definitely not fully automated and takes a single person 1 day to get the report.
We were earlier using Excel to get the reports. Using Excel was more tedious as it required you to get the data, clean it up, then apply the lookups, consolidate the numbers and get the results. This was quite error prone and took a lot more time as well.
I am not sure, how GA can be used to measure each touch point with the customer? If you have written any post on that tracking and can point me to the same, it would be great! I thought that tools like KissMetrics try to do that!
Paramdeep: Multiple touch-point reporting is standard in GA, please see the Multi-Channel Funnels report. More here:
https://support.google.com/analytics/answer/1191180?hl=en
More specifically you are looking for the Top Conversion Paths report:
https://support.google.com/analytics/answer/1191209
KissMetrics is a wonderful tool. You should definitely check it out as well!
Avinash.
Hi Avinash,
Many thanks for this post. It identified for me one of the biggest challenges to web/digital analysts today.
There is a horrible misconception in businesses and agencies that analytics tools such as SiteCatalyst/GA/Webtrends/Coremetrics should be the fountain of all data knowledge. When it becomes apparent that these tools don't.
I have consistently experienced an unwillingness for businesses to roll their sleeves up and pull together their data from different sources. Why? Often because of technical reasons, sometimes a bit of company politics.
A project I recently worked on demonstrates your point exactly:
I was working with another marketing agency on analysing a leading 2nd hand car dealership in the UK. The primary purpose of the website was to drive traffic to their locations by encouraging people to book a test drive. Clearly there are a number of steps after booking a test drive:
– How many people turn up for the test drive?
– How many people apply for finance to buy a car?
– How many people qualify for finance to buy a car?
– How many people actually buy a car?
All these steps were offline yet the client, even after much discussion, refused to see the benefit of merging their web analytics data with their offline data sources to get a truer picture of which marketing channels were driving the most sales rather than the most test drive bookings. Very annoying but all too familiar.
One thing that I think is often left out of this type of end-to-end analysis is the business effort that goes into driving traffic to the site in the first place. I'm thinking here in particular B2B businesses in which they have sales teams that may do a lot of the awareness work up front but then the website takes over for some or the remainder of the sales process. Its just as important to understand all your marketing and sales costs as it is to know your true sales and transaction data.
Cheers,
Al
Al: Really great insights, and thank you so much for sharing the real world case study of the dealer.
The sad part is that for a car dealer type gig, they are not huge in the grand scheme of things, all we need to do is get some kind of primary key in our hands and we'll be able to do a lot of tracking (manually initially, and later automatically).
Yet, as you say, they are unwilling to even listen a little. A lot of it is an error in their judgement, but I do place a lot of blame on us in not being able to make the case of value derived.
On your last point, I agree with you. In this post I was trying to keep things simple and just focus on the real desired outcome (profitability). But we can apply this type of "reverse segmented triangle" on the acquisition part and get really good at understanding all acquisition efforts. (Here's my post on how to measure online impact of offline campaigns such as TV, Print etc: Multichannel Analytics- Tracking Online Impact Of Offline Campaigns)
Thanks again,
Avinash.
It's like you're spying on us, Avinash!
We don't stop at the start – we go a few quarters into their student experience to see which channels promote the best retention. The first quarter/semester is just the first step, and you'd be surprised what happens throughout and after this very important phase of a new student's academic career.
Generally, the more informed the student, the better the conversion/retention.
Go referral and search!
Avinash, I have been reading your material (books, blogs, etc.) for a while and this is one of the most helpful posts to date.
I have just begun researching how to best analyze B2B websites and was coming to many of these conclusions. You have done the grunt work here and put the thoughts down in writing so thank you for that!
It is amazing how much information is needed beyond what is available in an analytics tool to truly do a good job. I really like how you suggest to see things through all the way to the finish (completing the course in your example). This will certainly be hard work regardless of the type of organization being analyzed but hard work leads to great results.
Thanks again for all your helpful guidance!
Great post Avinash!
I was reading through the first example and all I could think about was my own eCommerce environment and goal of determining customer lifetime value by marketing channel and then, of course, you covered it!
The offline piece is a challenge but it's also an opportunity to put a feather in an analyst's cap as he/she demonstrates a willingness to go the extra mile or close the total loop.
Great quality post, keep it up!
Anthony: It is not just any feather in the cap. It would be the highest quality, most beautiful proud peacock feather!
Conceptually this is easy, if you are a savvy communicator then you can over come the politics and technical hurdles with some efforts. But it does take patience and drive. And if as an analyst you've done that, you can have any job you want and indeed command a very high premium for your skills!
Avinash.
Loved the post, really helps bring to light digging deeper into data driven solutions.
With Universal Analytics custom data sources and this post, my Monday is now great! :)
Thanks Avinash!
Alan:
I have a couple of issues with this, Avinash. Specifically, the section about ZQI's conversions.
What a lot of EDUs find is that their enrolments come from a lot of different sources, but also with a lot of different characteristics to their enrolment path. For example, a lot of universities here in Australia are now finding that their new influx of students from Asia are attending the same Uni as their parents did. That means you've essentially got a new enrolment from someone whose eventual destination was written in the stars; very different from a conventional purchase research funnel.
Then you might find there's a middle-tier, where prospective students might attend an open day, follow a handful of uni's on social and EDM, and generally make the choice based on gut feeling, or where their friends are going, or other factors along those lines. Those folk have probably been aware of the uni for a long period of time, have selectively opted-in to marketing messages… effectively pre-qualifying themselves.
And finally… aggregators. These are like trawler nets, picking up a lot of academic flotsam and jetsam. The aggregator is the first touchpoint with someone that is yet to form any sort of attachment to any university.
Is there not an additional dimension to consider — namely, the effectiveness of the aggregator channel in generating enrolments from "new" prospects?
If there's no accounting for the different role that each channel plays in terms of the audience it connects with, I fear we'd end up with the conclusion that the channel targeting the most qualified section of the audience performs best. And that strikes me as a little like comparing apples with oranges :)
Damion: Please see my replies to the first two comments in this post. I've shared thoughts on optimizing the "top of the funnel" (by touching on attribution, controlled experiments etc.).
If I put on my analyst hat…. you've outlined a cluster of hypotheses on how students research and enroll. Your theories about parental influence, value of open day, etc. can all be validated easily with data.
For example "direct visits" (to use web analytics lingo) can be researched qualitatively and we can see if indeed it is parents sending their kids to the site. Or in our funnel we can see people sign up on the site, show up at the open day, massive abandonment (or sign up) after that. We can pin point value of a good or bad open day.
I would encourage you to create these hypotheses (including your last one about aggregators sending new prospects – that is immensely easy to analyze), use the data to validate them, then optimize the top and bottom of the funnel by mixing relevant online and offline data sources.
I'm greatly appreciative of your wonderful comment!
-Avinash.
Well said. When we deal with our clients, many of these Analytics principles apply.
Thanks for the relevant ideas.
What I already found in my short marketer / analyst career is that one quickly becomes very skilled at identifying real benefits and justifying spend when the budgets are limited.
The moment you need to put ROI next to every thousand (even hundred) you spend on an acquisition channel, you adapt. And you adapt by digging deep and finding the correlations (or lack thereof) needed to promote or demote a certain channel.
I remember how a few years ago, during my first "affair" with Google AdWords, I wanted to be able to tell a friend that the channel worked. I changed his website, restructured his AdWords account from the ground up – the best I could – and things started to work. We had visits and we had leads and we had sales.
But it was complicated. We had no click-to-call extensions, and although I could clearly see what people searched for and where they came from and what they were looking at, we simply could not link the visit in Analytics to the call he received. And he could not ask his potential clients about their pre-call path.
So I took a step back and told him: "listen, if we could find a way for you to say, at the end of the campaign, that X dollars invested in Google AdWords brought you Y dollars in profit, and if Y > X, would you be happy?" Surprisingly, he said yes. So I came up with the "poor man's call tracking" for him. I asked him to give me another phone number, which he did not advertise on his website. I checked server-side for the visit source when someone arrived on the website, and if it was AdWords, I dynamically switched the regular phone number with the "AdWords" one. I also set a cookie, for three days only, so that if people did not call right away, they would still see the "AdWords" number for three days after their AdWords visit.
And I think that, to this day, one of the moments when I was the proudest of my achievements in this field was when we were walking around his beautiful flowers, in the greenhouse, and his phone rang. He smiled, picked up his phone, and before he answered, he said "AdWords". A few minutes later, a deal was struck, and a customer was "tagged" with its acquisition source. And when the season ended, and the line was drawn, he could clearly see that the investment was well worth it. And kept doing it, and kept growing.
Fast forward about two years, different country, different company, different budgets. We were dealing with E-Commerce, and when looking at Analytics data we could clearly saw who the emperor was. Huge sales, loads of traffic, one of the best conversion rates, more than decent average order value. While another shop had a lower conversion rate, less traffic, less sales. But as soon as the camera moved away from Analytics and towards the ERP, bam! ( :) ). The emperor had no clothes. Although revenue was higher for that shop, the one metric that mattered, which in our case was, of course, "profit", was not so impressive. And again, I had to prove that paid search was working, so I kindly asked my fellow programmers to import some data from Analytics, piece it together with ERP data and wham!, we could see Profit per sale and per channel, not just revenue. And I realized that we should watch the advertising costs of the naked emperor more and also turn towards ordinary people (apparently less performing shops but with higher margin per sale) a little more.
Of course, when you have applications that track everything for you, all you need is to bring the data together. And if the business' scale is higher perhaps the greatest endeavor is not to piece the data together, but to bring teams and mentalities together.
Somehow though I think that smaller marketing budgets, closer teams, a certain sense of scarcity, as opposed to huge yearly marketing budgets which everybody knows they're going to be spent anyway make you nimbler, more aware and hungrier to prove that something either works and should be promoted or doesn't work and should be discarded. In a way it's like shopping: when you know you can't afford everything on a list, you start checking and optimizing. When you know that you have to buy everything on a list in 20 minutes, and that your monthly budget will not be seriously affected if you save a dollar here and another one there, your behavior changes. You suddenly focus on different metrics. Cost is less important, and "conversions per minute" and "task completion in the allocated time" are paramount :).
Thank you, Avinash, for another great, thorough article.
Calin: These are such great stories, I wanted to thank you for taking the time to share them with all of us!
-Avinash.
Great article, as always, Avinash!
I would love to duplicate your awesome chart with my own data. Do you have a sample chart and set of data available that we could customize? What type of chart is that?
Gordon: I'd used a internal tool and so I can't share a template. But there are so many publicly available options. Checkout these two:
~ How-to Make a Sales Pipeline Funnel Excel Chart Template
~ Yet Another Sales Funnel Chart in Excel
Many BI tools, in case you have access to them, like MicroStrategy also have these types of charts built in.
Avinash.
Darn – that visualization of abandon rates at each step are awesome and something that the excel funnel charts just don't convey well.
I always turn to your blog when I want to know about analytics – how it works in digital marketing and why is it important to a business.
It is really true that every strategy would only considered effective once the revenue is generated through an increased sales.
Thanks Avinash for this post. ;) – First time to see your blog.
Thanks a lot Avinash.
Really great points. The process you explain is what I`ve been and I`m working on at the company I work for – BTW: typical multichannel-but-very-digital-oriented, B2B, sales-driven global company.
It`s also the only way to create real collaboration and communication between Marketing and Sales, not always so easy and smooth in this kind of environment.
Avinash, from my analytics I know that…
organic search, when compared to paid search generates:
10% higher avg basket sizes ($)
2.5x higher conv rates (%)
2.3x higher per visit values ($)
paid search, when compared to organic search generates:
2.5x number of transactions
3x revenue ($)
Where would you recommend I spend most of my marketing budget?
Lily: I know this might seem insane, but from the data you've provided it is very hard to recommend what you should do.
Part of the reason is that I don't know what your business is overall trying to solve for. Or where it is in its current growth (for example at an early stage I might be happy with higher conversion rates but less revenue, or happy with more visits and fewer conversions).
A part of the reasons is I've not spent enough time looking at all your other channels ("All Traffic Sources") and see where PPC and SEO fit.
A big reason is I don't know what your search strategy is. For example a simple search strategy is to get a massive amount of brand and "head queries" via SEO and go after the "lower head" and "long tail" via PPC because you can't get from SEO. That would then dictate which metric I use to judge show well overall search is doing and where I would invest more.
In that context you might find this post to be of value: Analytics Tip #10: How Thick is Your Head and How Long is Your Tail?
I hope this helps a bit.
Avinash.
Comment moved from Google+:
I really like your view on getting outside the boundaries of web analytics. People should not constrain them selves to what a piece of software offers. If the tool only makes part of the job done then include more tools both digital and non-digital.
What about adding multichannel views? What you show seems to be last-click and we all know that this isn't the real picture. Aggregators could be perfect for initiating interest and leaving it up to a brand search to close the deal. Another thing to consider is what is the cost of using each channel. Search could be an expensive way of getting sales for some keywords.
Philip: For the "top of the funnel" (the activities driving people to your digital presence) we already have some very cool ways of understanding how channels interact with each other. An example is the Multi-Channel Conversion Visualizer in GA.
From here we can go deeper and see the order in which the person was introduced to us, how many more steps were there, in what order each channel was present, etc. etc. All standard reports.
But all of this is just for the "digital conversion" (or Lead in this post). My emphasis is that it should be for the business profitability point.
Thanks!
-Avinash.
Hi Avinash,
Thanks for a very useful post, touching on something I'm actually working on right now.
What I'm struggling with is connecting the GA data with the CRM. For example, how would I work out which lead was from which source? Currently the CRM captures all lead sources from the website simply as "web site". So I'm not sure how to segment the origin source of those leads? Is that something I'd need custom variables to do? And how would it be done without using personally identifiable information – just through a primary key?
Is that something we can do with current GA, or only with UA?
Thanks!
Adrian: The simplest way to think about your challenge is that GA, like so many web analytics tools, is take out only. It does not take "external data" in (though you might say all data it collects is external data :)).
What you are trying to do is pretty straightforward. But you should do that with Universal Analytics because it would be a "two way" system. You can take data out and you can send data in.
Here's how you can set up GA:
https://support.google.com/analytics/answer/2817075?hl=en
-Avinash.
As usual, your post went right to the point of business and profitability.
I started to think if wouldn't be proper for web analysts actually to be called business analysts and get paid for that too…. :)
In order to prove that ROA we need to do major changes in our clients reporting system and most of the time this is the biggest challenge. We need to "fight" with all the departments involved in this process…
Hi Avinash, I love your posts! Spot on.
I hope you don't mind my posting here, however we've built something that I think may be of interest to the contributers of this thread that will help get them closer to your modelling:
We've been tackling this issue (also originally inspired by our Edu clients) by building an app that tracks all online and offline lead sources and entry points to a business and capturing data at the source as apposed to having an agent ask "where did you hear of us?). We're integrating with GA accounts to identify impact of offline to online and integrating with CRM to match the source with the sale and scoring campaigns and channels. It's not been uncomplicated or inexpensive, however we have it launched and it's working as expected and available for anyone to use if interested.
We'd love a community of deep analytical thinkers in there with their clients leveraging all of the data from all channels. We'd built it for ourselves to help justify our clients investment and then, to optimise it and then realised we were solving much broader problems
Avinash – thanks again for your generous sharing of intellect around all of this. It's appreciated and very helpful.
Cheers again
Adam
Hi Avinash,
Excellent post, however it is kind of sad that a lot people still just go by "Leads/Visits = My SuperDuper Conversion Rate" mindset and worse, set their marketing budget accordingly.
Honestly, it is all about how you define "conversion". If marketers still define it as "leads", that is going to hurt. Your conversion rate should always be your end goal / # of visits, in this context. Hurray if you measure your % rates for each step going to that conversion (helps in evaluating your funnel, flow, whatever you want to call it) but source attribution, at least, should focus on the step you make money at, period.
That being said, this is not always easy because of the gaps between web analytics and erp systems. I always advocate implementing a source attribution feature to the erp directly, however, it is especially tricky if a typical customer comes in via 5 different channels in the course of a month or two (adwords->direct->email->display->facebook) and converts (e.g buys something, if you're an e-commerce site) multiple times. This is actually very typical for e-commerce businesses that can afford it -since you are almost always advertising with all the channels you can, to get the users to your site-, and I am curious if you have any insight on how to handle the attribution in this case.
Especially in the "long-term analysis" type of things, such as "LTV by acquisition channel", this creates a lot of confusion (for me, at least). Should we attribute it to the first referrer, the last referrer, the last non-direct referrer, a combination of all three or may be even add some more elements in there?
I'd love your insights on the matter Avinash,
Cheers,
-Can
Can: Please see my reply to the first two comments on in the post, I address attribution modeling thoughts there (as well as #26). If I were to summarize, attribution modeling should be a part of your life, regardless of this post, but it is the point at which you consider the conclusion that makes all the difference in the smartness of the decisions you recommend.
Bringing Lifetime Value into the equation does make thing complicated, but, as I mentioned at the end of the post in the Ecommerce example, it is strategically important. Think of it as strategic analysis you'll do on a monthly, or even quarterly basis for small businesses, to identify repeat purchase behavior from the media mix you have. It is hard. I give you that. :)
-Avinash.
Hi Avinash,
Impressive post as usual. One of the things (and I have said it before) I have always liked about your posts is the fact that you provide a ton of information and the reader can really contextualize any piece of it to fit their needs.
I loved your statement "The challenge, of course, is that getting leads adds zero value to the business" – very true. Totally agree that if your leads don't add to the bottom line then you need to rethink your paths. Also, in this regard CPL (cost per lead) for each of these channels is another factor to consider. And as you said, it is better to start simple before getting into rocket science stats & formula to calculate value.
One of the 'quick' metrics I myself have used to quantify the value of channel (vis-a-vis leads) is to look at the Activation Rate by channel. It is pretty much the twin of abandonment rate, only here we are looking at folks that did what you want (end conversion) as a percent of the total folks that came in through that source.
There are a couple of other things I have used and you touched on them in your post & comments above. One is of course looking at Attribution over a lookback window (whatever is appropriate for your business). This ensure a bit more fairness to the channels as some channels do play a bigger role as openers rather than closers and so the attribution allows us to give some credit to those sources.
The other is taking your concept of repeat purchases a bit farther. We can create a simple grid (in Excel or using some other tool) that looks at "Days Since Last Action" (Recency) x Value of that action (# of orders or any relevant metric) by channel and this gives us a lot of insights. Which channel brings in the most engaged visitors? Which channel is on the 'decline'? (lot of high value customer before but now less engaging) etc.
In terms of challenges, what I generally see is folks not paying enough attention up-front in thinking about the 'keys' that can link various sources. Without some sort of key, not even David Copperfield can sync up two disparate sources of information (of course, you can do some sort of correlation analysis but that has its own pitfalls and dangers). So my advice has always been to think ahead when you are considering a new tool or a new source in terms of how you can link that up with the back-end databases or other CRM info to do some cool stuff.
Thanks for a great read!!
As others have said, great post.
I came to this conclusion in a way that web analysts might consider 'bass ackwards:' A close friend of mine, who became a client, runs a small business (junk removal). Upon recommendation from their corporate office they had gone with an AdWords vendor who had also installed–but never once utilized Google Analytics.
When I started, I (of course) looked at GA and WMT. It was disastrous;average load times longer than average time on-site, keyword profiles that didn't reflect the business, etc.
I contacted corporate about it but they shifted into 'cover my ass' mode.
I was stuck with data with little correlation to real events (for instance, they tracked AdWords conversions, but every page/keyword/ad reached the same 'goal' page so I couldn't asses effectiveness beyond which campaign had more conversions).
I began simply telling them: this is what my limited data view suggests, please review other (offline) data and see if these patterns make sense.
Beyond that, they had serious problems (especially with page load times) so I told them 'I won't be able to see any of this but with the page speed problems you have I am going to put the 800 number (for booking) in big, bold text in the upper left corner of every page so that anybody that wants to book instantly can easily do so,
While I have never been able to gather any analytics data on these actions, I know they have worked by the growth of my friend's business.
It brings to mind A.B.C.: Always Be Closing.
Thanks for reminding me of the actual goal, it is easy to get overly concerned with micro conversions and digital.
Adam: The situation you describe is tough, but by no means abnormal. The scale might be different, but Analysts have to, painfully, deal with this type of a situation all the time.
Given the situation I'm not sure if they will want to put in the effort, but Phone Call tracking (from Search to Site to Call Center) is not that hard. You can see a bunch of apps that do that here:
~ Google Analytics Phone Call Tracking
Good luck!
-Avinash.
Thanks for referencing potential solutions.
I had grown so disillusioned that while I knew my changes helped, I had given up on knowing anything more. It turns out the 'cover my ass' lady (the head of marketing) has since been replaced and they are (finally) re-doing their website.
Due to past experiences, I am skeptical, but something that allows them to painlessly track conversions via phone calls would be ideal so I will investigate fully. Thanks again.
Hi Avinash,
As always the hard part is when you look closer into the details. The join of data is really a huge challenge.
So for example a content driven site, like a blog, mostly supported by ads. How can I join this both datasets?
Analytics should wait till all banners are loaded to send the pageview (which is not that much of a great idea, since I would loose lots of pageviews cause they just drop off before all the ads have finished loading; OR you gonna have the ads to get to know on which site they got displayed) Either way you will need the primary key for a join.
You have any more thoughts on this topic, or consider writing more in regards to?
Best,
Michael
Mischa: Depending on your situation, it is a little bit of work or a lot of work.
The situation you described might not be as hard as you think. For example if you are using the Google Tag Manager it can be easier to avoid the tagging issues you mention. The tags will be loaded asynchronously, and first, and hence ensure more of the time you collect more of the data.
In other cases, like AdSense or DoubleClick, there is a fair bit of pre-integration with Google Analytics you you might in many cases not even know two tags. Check that out.
Where things are harder are when you want to make the join (and hunt for a primary key) when it comes to offline sources. At the moment this means taking data out of Google Analytics and it is a bit more painful. With the release of Universal Analytics it will become easier.
It is well worth still putting in the effort because the payoff is big.
Avinash.
Hi Avinash,
As always a good one.
2 points on your last graph:
1. From visits right down to RFP's there is 0 revenue. However there is also cost. It should actually reflect a minus as this shows acquisition cost. Would you agree?
2. Revenue starts during last step (but break even and profit may only come later in the customer life cycle process)
Theunis
Theunis: My answers….
1. There is cost all along the process. At the top of the funnel there are acquisition costs. In the middle there are costs for phone calls handled and product samples and so on and so forth.
So I would not keep it to RFP stage. If you want to apply cost, consider all of the cost.
2. It depends on the type of contract signed. Some contracts are all front loaded, so you can recognize revenue, compute profit right away. Other contracts have weird structures and we have to take those into account. Regardless, we should focus on profitability (and, as you rightly mention, after taking costs out).
Does that make sense?
Avinash.
Thanks Avinash, makes sense.
It all depends on how you want to view it and what the context of a particular situation is.
Theunis
Thanks for sharing this wonderful post Avinash… It was worth reading.
I have a question to ask.
Is this digital analysis same for the whole geographic area? As I am doing business in Australia I am more concerned about this region's digital analysis. It would be great if you explain some analytical facts on my concern.
Warm Regards.
Anna Dawson.
Anna: There is nothing geographically unique about the recommended analysis (/obsession with business outcomes).
Regardless of the digital sophistication of the country, type of business outcomes we are driving, the article makes the case for the astounding value of doing this hard work.
-Avinash.
Hi Avinash,
I'm with Adrian above. I have GA info, CRM info and enrollment info. I'm not sure how to tie them together with the lead ID. It's GA that I am having trouble with. In the CRM I have names, emails, etc….in GA everything anonymous. What do you use in GA data as the lead ID?
Thanks so much for this post! EDU analytics/ROI posts are rare and this helped me a ton…it also helped me communicate what the heck I've been rambling about to our marketing and financial people.
jil
Jil: You can use the Universal Analytics platform provided by the team at Google to solve this problem quite easily. You can learn more about it here:
https://support.google.com/analytics/answer/2790010?hl=en
Ok, it is not easy for everyone (and me!). You and I might need a little bit more technical help. So please checkout the list of authorized consultants here: http://bit.ly/gaac
Avinash.
Avinash – this line here helped my entire professional career… From birth to jedi. I wanted to come back and thank you. It just took me a little bit to learn things on my own, and now I'm back here to explain I've impacted 2.2million employees – every single day – use my data solutions, business intelligence solutions, and tableau dashboards.
You've made a big impact having lead me there, thanks for that. Here's the quote that will give you a nice story! Sorry I'm usually a 'long read' blogger these days.
"The challenge, of course, is that getting leads adds zero value to the business."
Before I explain, I wanted to tell you I just had my first PR release and had completely turned into a blogger VS a consultant.
At the last (dot)com I was working at – I was the only person working towards building leads from an SEO perspective for over a year. Getting in community blogs, answering questions, and being available from a public viewpoint. I was the web dev and was always fixing how these links affected our end website.
When even attempting to ask for blogs of everyone – it was crickets, and I'm reading content like yours and others understand that it's everything. It's the world. Sharing content is huge – and I was quietly doing it for decades. No one explained it quite right.
Well, I'm just swinging through my history and making sure I say what needs to be said. Thank you big time from over here in Silicon Valley Austin, TX.
It was odd, I see leads coming in, we have new people, and everyone is slammed. And I was effectively bled dry doing a 100% commission job with my 'friends.'
So I figured, better work harder, I started blogging. Researching.. Reading content like your content. Meanwhile, everyone else is busy… Billing clients… And hiring? Mind you I'm the only person with a technology degree, so legally speaking I'm the only person certified to help our enterprise customers with their data environment.
I started tapping my foot. And researching this type of content. And found you.
I have been whiteboarding for 6+ years now as a solution architect – tip of the spear. I love your content, and I love how easy it was for me to familiarize and memorize for the time I needed it.
So, 6months of not getting a single lead on my plate, and everyone else was billing full time… It was evident my zero value to the business, was the only reason the company existed. And the entire time everyone was cherry-picking leads and dropping hard ones on me only.
I learned a lot about transparency from a consulting perspective, and I believe you brush across it very well. As these layers should be identified and grouped logically as you do here, and similar to how I've whiteboard-ed with people over the past 3-4years…
Now I don't take my laptop when I'm onsite because I am never doing any implementing, more so we are building these types of environments together, and troubleshooting from a blimp view.
Thanks for the choice words many moons ago. They apply extremely well today in the big data solution world.
I was merely working 60 to 80hrs a week, billing 10-15hrs a week, everyone else was billing 40-50hrs, and everyone thought it was because I was doing something else. I spent a relentless amount of time researching the unknown and discovering my free time was being absurdly thrown away.
Mind you none of them have technology degrees, and the word backlink is just beyond their vocabulary currently.
"The challenge, of course, is that getting leads adds zero value to the business."
The process of 'getting' leads is extremely valuable when you work with professionals who understand the mechanics of modern technology.
This is a challenge to understand when profits are coming in. But when long-term scalability of a company is a risk with every new client and every new hire, there has to be a point where you realize the important truths of bootstrapping for free and building those leads…