 Like a vast majority on planet Earth, I love data visualizations. Ok, so perhaps as the author of two bestselling books on analytics I love it a little bit more!
There is something magical about taking an incredible amount of complexity and presenting it as simply as we possibly can with the goal of letting the cogently presented insight drive action. Magical.
A day-to-day manifestation of this love is on my Google+ or Facebook profiles where 75% of my posts are related to my quick analysis and learnings from a visualization. Be it looking at 1.1 million FCC net neutrality comments, things people around the world identify as their biggest threat, water consumption of a burger patty vs. daily cooking, the religious gap on spanking children, or a simple graph that rises profound questions about where we donate vs. diseases that kill us.
Data visualized is data understood. Better. Faster. More useful. It delivers world peace!
I'm exaggerating a tiny bit. (As is clear from the discussion on the preference of guns over knowledge in 37 US states. But at least we're talking.)
In this post, I want to share some examples of data visualization I was excited about recently. In each case the creator did something interesting that made me wonder how I can use their strategy in my daily efforts in service of digital marketing and analytics.
We will look at six short stories. You are welcome to read them all at once (warning: once you start you won't be able to stop!), or you can consume them one at a time. For four of the examples, I'll also share how the visualization inspired me to apply the lessons to my web analytics data. In the other two, I'll ask for your help in how you might connect the inspiration to your work as a Marketer/Analyst.
Short story #1: Treemaps, Sunbursts, Packed Trees, Oh My!
Short story #2: Predictive Modeling, Quantifying Cost of Inaction.
Short story #3: Streamgraphs, Data Trends Diving Made Simple!
Short story #4: Multi-dimensional Slicing and Dicing!
Short story #5: Segmented Stacked Square Charts.
Short story #6: Conditional Formatting, Simple Strategies To A Drive Big Focus!
Six stories, a total of eleven different data visualization techniques to inspire you to think different at work when you play with data. Ready?
Short story #1: Treemaps, Sunbursts, Packed Trees, Oh My!
Our lives are dominated by columns and rows. [And sometimes they are indeed optimal: 7 Data Presentation Tips: Think, Simplify, Calibrate, Visualize. You'll also see examples below.]
So a table like this one is par for the course for you.

Table comes in. You do you best to understand what is going on. Yes you see the numbers, there are lots of them. You scroll up and down. Nice. Some countries use a lot of oil. That's just the top 12 rows, there are another 196 rows of data. Sure, sure, sure. Long tail . Yippie!
But how can you be expected to understand it all? How can you understand enough to at least pick directions you want to go down?
The table above is from Stats Monkey. Their approach is to actually present the data using a Treemap (they call it a squaretree for some reason).
It is so much better!

You can suddenly see the forest and the trees. (Get it?)
The few dominating countries (USA! USA! USA!) are more clearly visible, and you get a much stronger sense of proportions. Yes, you could see in the table that the US was bigger than China, but the Treemap really brings the comparison home. You start to see weird things like Russia and India are the same. Yes, it was in the table. But for a visual person like me, this is the ah-ha moment.
While you can't see the smaller consumers all that easily, you can hover your mouse and see the details.
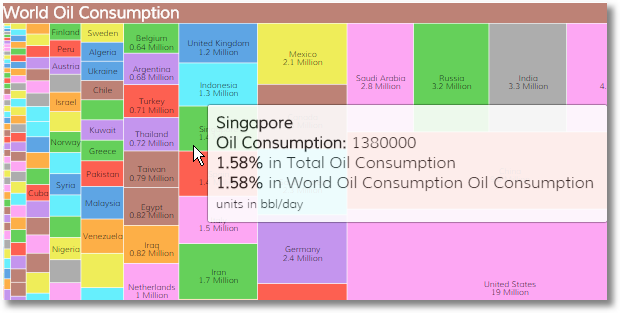
Additionally, you can go down to the little ones, now that you have the ability to easily do that, and point and hover.
Three cool benefits: 1. Treemaps are a great way to visualize a lot of information. 2. They are really good at showing the differences in the big head and the long tail. 3. They can form the foundation of allowing data consumers to drilldown into the represented segments.
One of my favourite implementations of Treemaps is in the competitive intelligence tool Compete. It shows all the incoming traffic to a site as a Treemap.
At a glance you can see all the big clusters of sources (close to the channels view in Google Analytics).

You can hover over each box to get a sense of the key metrics. Number of visits, percentage of share of total visits and the percentage change (which you can discern from the color of each box, in that sense the Compete Treemap does not use color just for decoration).
If you are interested in any particular channel, Miscellaneous as an example, you can click on it and… boom!
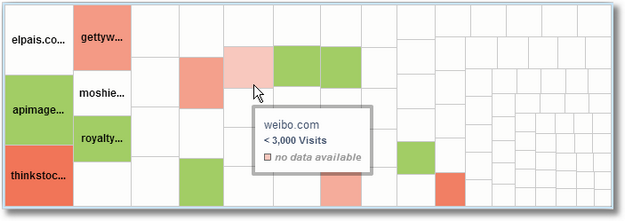
You see the big ones named, the hidden mysterious ones, you can unmask using a mouse hover.
It would be nice to see all the sites named, but it is kind of nice that it forces you to internalize the big ones, likely where you can have the biggest impact, and then look at the small ones.
Net, net. A delightful way to take your 198 row table and present it in a manner that aids stronger understanding of performance.
Let's go back to our table, and global oil consumption.
Stats Monkey also presents that table using the Sunburst visualization…

Perhaps compared to the Treemap, this visual shows fewer countries and fewer actual numbers of oil consumption due to space limitation.
You can still hover your mouse and get the details of each country. Additionally you can click on any country and just look at that one. Better than the table, but perhaps less optimal than the Treemap.
I want to use the above visual to share with you how much I adore the Sunburst visualization. I believe it is best at describing sequences of events. It is best demonstrated in the example below, which illustrates the path followed by a group of people on a website.
![sunburst[1]](https://www.kaushik.net/avinash/wp-content/uploads/2014/11/sunburst1.png)
You get a confusing little thing, but the visualization is interactive. You simply move your mouse and it illuminates the journey and how many people follow a particular path.
For example…

You can configure what the end is, in my case the end is people who converted. Now I can quite literally follow the path to every conversion. I can find the biggest pools of customers who share a behavior and go back and optimize my campaign strategy, my content strategy and indeed my overall digital strategy.
I've used Sunbursts to do the same with keyword portfolios. No better way to optimize for all of search behavior, rather than the absolutely silly obsession with a few keywords (it is fatal when apply to single session conversion scenarios!).
The Sunburst visual of our oil consumption is nice. But you can see how much more powerful Sunbursts can be. Learn how to use them from this tutorial, which is linked off my most beloved data visualization source d3js.org.
One last nice visual from our friends at Stats Monkey. This time around using a Packedcircle…

Pretty mesmerizing, right? It does serve practical value as well.
You can visualize the sizes a bit better. You have the ability to still get the details when you hover your mouse.
For the Packedcircle they also provide a list of countries in the table, now you can choose the one you want from the right side and go to the one you are most interested in.
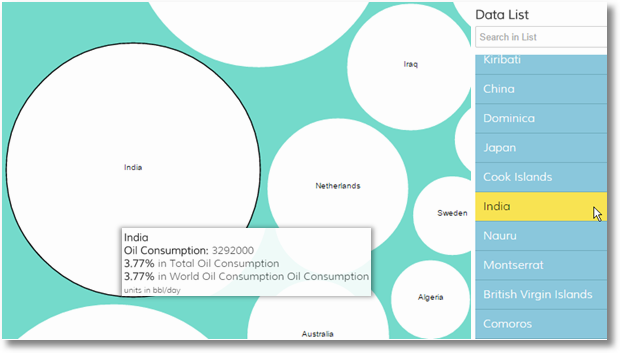
You can see the country you choose zoomed in context of the others that are around that same level of consumption.
The Treemap, Sunburst and Packedcircle demonstrate three possible paths you can take to go from a table to something much more understandable and much more interactive. It makes understanding data incrementally better, and encourages drilling down and exploration much easier than the table.
You've see the application of content consumption and keyword analysis using the Sunburst above, and the use of Treemaps by Compete. I was inspired by the above work to apply the Treemap to our day-to-day work, let me share that with you.
There are many ways to create Treemaps online. I used infogr.am to create mine below. They have a free option, you can try it yourself.
This Treemap illustrates the traffic sources and the number of Visitors. It is created using the All Traffic Sources report in Google Analytics, and clicking Source (rather than the default Source/Medium).
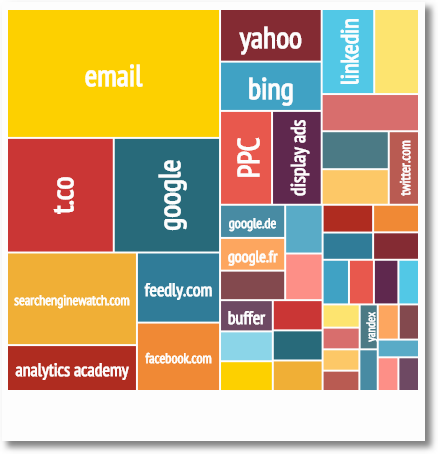
You can have a simple table that shows the visitors, but this is so much better in being able to show so much more data, much more easily. It is also so much nicer in being able to illustrate the proportional differences between each source.
As in all cases above, you can hover your mouse and get the specific number of Visitors.
When I'm creating a dashboard for a high level view, I would take the Treemap above and combine it with the one below that illustrates the amount of Goal Value delivered by each source.
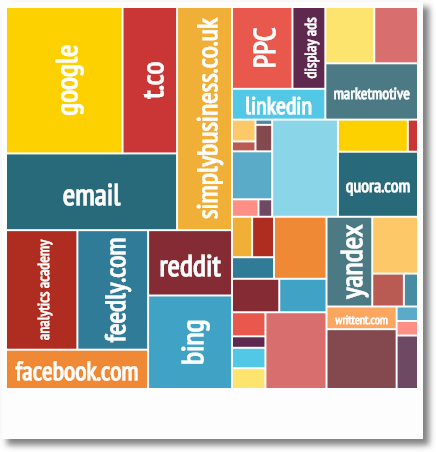
I am sure you have noticed that the sized of each source in the Goal Value Treemap is different from the Visitors one. This allows for very quick understanding of site performance and the asking for very good questions very, very quickly.
I also want you to appreciate that you can't actually show this in a table. You would sort the table by count of Visitors, in which case some of the rows in the second Treemap would disappear, or you would sort it by Goal Value, in which case some of the ones in the first one would disappear.
You can definitely have two different tables with this data. In my case, and this may vary, it is not as easy to connect the dots (both on proportionality and deltas).
And that, my dear friends, is the power of simple visualization.
Let's look at some more.
Short story #2: Predictive Modeling, Quantifying Cost of Inaction.
This example is about the very sad reality of the Ebola epidemic and the sadder still inaction by governments (like ours). The work of the New York Times team inspired me it to do some predictive modeling for inaction in our world of digital marketing.
Ebola is an extremely serious topic, and I do not mean to trivialize it in any way by using it in the context of learning a digital analytics lesson. If this is upsetting to you, I do apologize sincerely in advance.
I found the NYT interactive visualization to be extremely illuminating: How the Speed of Response Defined the Ebola Crisis.
It shows the low and high estimates of infections of Ebola due to this terrible disease. It also allows us to predict what would happen if we delay action, by moving the blue dot on the graph.

Ignore the black line for a moment (it shows the actual reported cases of infection). The graph below shows the predictions of what would have happened if aggressive intervention started in June 2014. The high and low estimates of cases, as you can see below, would have been much, much lower than reality.

Countries with the money, resources and knowledge to deal with an Ebola type epidemic did not come to the rescue of the African countries as fast as you might have expected. Empty words of support and urgency were delivered (along with calls from the ill-informed to shut down flights etc.).
At that time these countries had models to predict what was the cost in human lives from inaction. Just move the blue dot. Let's say to August

Approximately 12k additional deaths. Very close to what happened in reality.
Large-scale intervention did not start until August, but thank goodness it did.
It is important to note that the high estimate includes deaths experts believe have been underreported.
At that time we could also have move the slider further ahead to model out the impact of inaction.

You can see that moving in Aug did have an impact, the black line, reported cases is less worse than it could have been. Even assuming that 12k is a lower number (lots of people don't report the disease). It also does not include the other countries beyond Liberia and Sierra Leone where we know infections and deaths have occurred.
If you want to see scary, move the blue dot to October.

I'm sure that information like this played a key role in getting our government, and likely others, to jump and take action when they did. Thank goodness for predictive models.
[Sidebar]
If you wonder why sometimes governments move so slowly, among the many other reasons, attribute some of the blame to the power of communication. The data used in the interactive visualization above comes from the Centers of Disease Control and Prevention. This is one of the fourteen tabs in their spreadsheet explaining all this stuff…
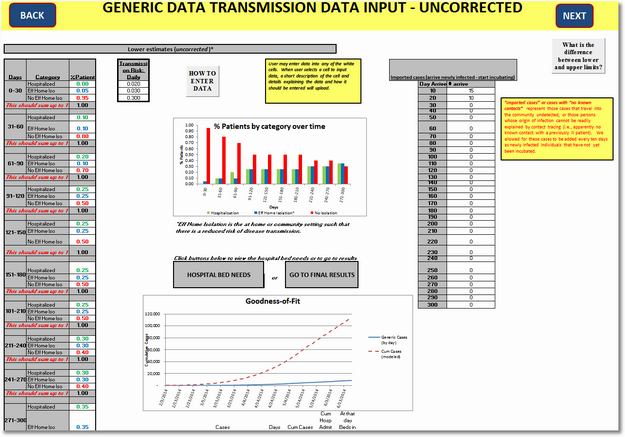
You can imagine how difficult it is to communicate what is going on – even after you give them credit for the fact that they are likely rushed and are trying to do a lot more in the spreadsheet. If you have an opportunity to do volunteer work for government agencies, please take the opportunity. Meanwhile, if you want to play with the Ebola dataset, you can download it here: Generic Ebola Response Modeling.
[/Sidebar]
This example got me thinking about applying the spirit of the visualization, without any of the technical resources to create it, to the world of digital.
The inaction that upsets me the most is senior executives in companies brazenly disregarding our recommendations for taking actions based on our web data analysis. It. Makes. Me. Mad!
Here's a simple predictive model (though that might be too pompous of a word to use here) to get them to take action faster. Or at least think a lot harder about not investing the little amount of money to take big action.
The core performance of the current website look like this….

While we are applying it to a B2B case, it could just as easily be applied to a B2C / Ecommerce scenarios.
We've dug deep into the data and we've found some inefficiencies/suckiness in the digital experience. We know the optimization that is required. some straight forward in the stop the bleeding category that can be fixed without much thought. A couple other things, including the lead-gen form itself, which we would test to improve performance.
We need to invest a small amount of company time/resource and an additional small cost with our Conversion Optimization Agency.
You present a verbose Word document/email with your recommendations. You wear a Superwoman suit and, as an agency, present black slides with light grey text and deep shades of blue graphs to make the case.
Nothing happens.
Why?
You did not make the whole thing painful enough. People respond to pain. No pain = inaction.
Do this… Create a table with the future Conversion Rate, resulting leads, use the value of each lead to compute incremental value to the company… all extremely straightforward columns…
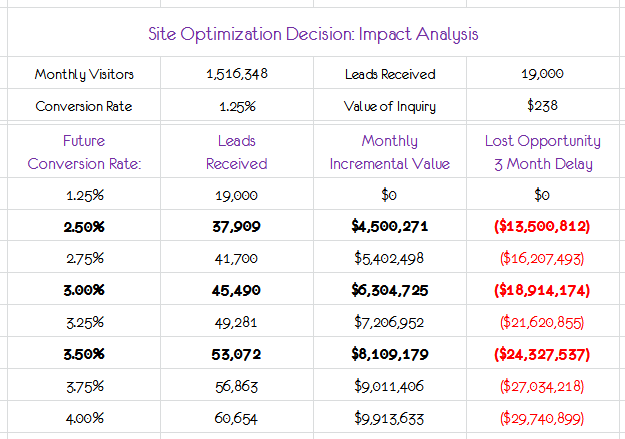
Then add the last column, the impact of not taking action for three months!
With the first just stop sucking we are predicting that the conversion rate can be moved to 2.5%. The cost to get that done is $200k. It sounded scary. Now, the $4 mil in incremental value eases the pain. And the leader, who by the way is smart, can look at the last column and understand the delay of not starting on the project right away!
The second bold conversion rate is what we predict we can get to with just stop sucking and our first two A/B tests on the product overview pages.
The third bold conversion rate is for what we predict after the package of changes, including multi-variate testing on the lead-gen page, will deliver.
With this simple predictive model the need for your Superwoman costume and black slides is reduced. Everyone can come together around a small table and discuss assumptions that went into creating it, argue about which changes to start first, and who to assign various parts of the project.
Action, baby!
The big challenge in creating this model rests on your ability to compute the business impact of the changes you are recommending. We as an ecosystem are not very good at this. But you can see how incredibly valuable it is.
You can make small improvements to make the table better (remember, tables with lots of numbers don't work as well as you might have assumed).
Highlight the rows, click on Conditional Formatting in Excel and choose Data Bars. I choose red to imply red ink in our accounting system from not doing what we are proposing!

You know where your eyes are going to go. : )
You can play with the formatting options to get the one you like the most. I'm partial to using the Color Scales in the Conditional Formatting section.
When we apply that, change the font color a smidgen, this is the resulting impact… a small improvement…

Once you have the initial predictive model, you can start to play with other scenarios and model them out as well.
For example, what would happen if we focused on not only improving the conversion rate from making changes to the just stop sucking, product pages and the lead-gen pages, and also impact the value of each lead inquiry?
What if it moved from $238 currently to $275? This…

Even stronger sense of urgency around action, and hopefully an ever higher willingness on behalf of the company to pay the Agency more, incentivize the internal teams with bonuses to take action even faster because actual company profits are on the line so clearly!
Since you have the model, more more thing you could add… the cost of delaying action for six months….

Can you imagine anyone in your company saying no to your recommendations based on your data analysis? I honestly can't imagine even the biggest HiPPO saying no.
The onus is on you though to first compute business impact and wrap it into a predictive model.
[All the computations above are quite straightforward, but if you would like to have a copy of the above spreadsheet just send me an email.]
Short story #3: Streamgraphs, Data Trends Diving Made Simple!
I'm giving the punchline away with my section titles, but stick with me. Pretend you did not read it.
Here is a lovely straightforward visualization.Worldwide Smartphone Sales by Operating System, in thousands. Nothing complicated here. BlackBerry is close to not much, even if the red line seems to be moving up (one challenge with this type of graph). So sad about Symbian.
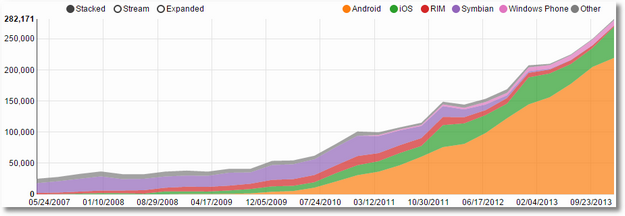
The raw numbers used for sales makes the above graph less insightful. The total number of smart phones has exploded to such a degree that the decimation of other platforms, and their sad lost opportunity even with an early start, is hard to see. All you can see is that Android is big, iOS is doing wonderfully.
The fix is not that difficult though. The creators provide a lovely option called Extended, click, boom!

Better, much better at seeing the trends.
Not only can you see more clearly how Android and iOS are doing, the massive scale of Nokia's missed opportunity is also more clear. Ditto for Blackberry. Windows Phone, an early starter, is also visible now.
Additionally, you see that Android seems to be going through its almost predictable dip every x months at this time with iOS predictably taking that share.
Each graph has its purpose, in my words above you can see the kind of insights that I was looking for. That drives the graph I find most useful.
While the above graph was pretty lovely, it was the third option that I loved the most. Stream…
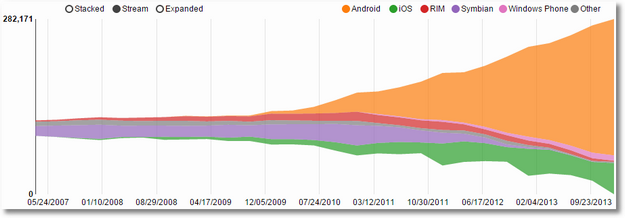
Now isn't that awesome?
I love the combination of two insights, one related to the raw growth of the entire space (so much better than the Stacked option above) and the evolving shares of each player (incrementally better than the Expanded option above).
You also have the capability of hovering your mouse at any time period and getting the actual numbers, should you need them.

The chart above is rendered using the NVD3 JavaScript libraries. It is an excellent resource for those with just a little technical aptitude. Here's my go to resource… NVD3 examples gallery of reusable charts.
The above example inspired me to share with you my use of Streamgraph as a visualization.
This example illustrates the presence of key concepts in my social activity on Twitter…

Rather than looking at a flat table, or lines or some such ungodly thing, I can see the concepts that become more or less important to me over time. For an analytics person my interest in Data seems to have a real ebb and flow. And why did I not care at all end of June and July? What caused me to really care in early Nov? All great questions, from a simple visualization.
I can of course focus in on just a certain time period…
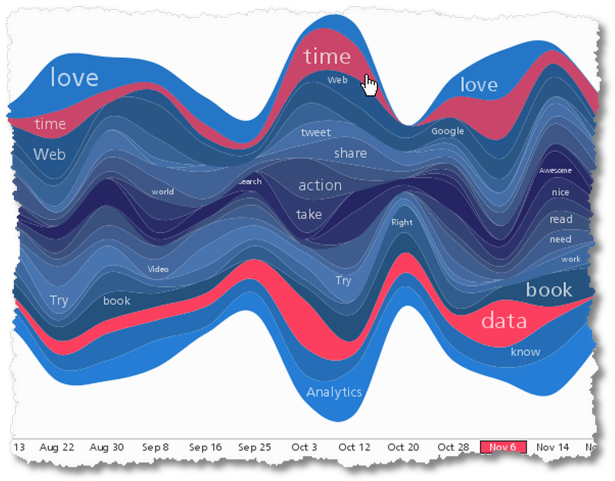
Or obsess about just one of the concepts and follow its journey over time.
In the streams are also concepts that became very important at a certain period of time and then died, some came back again later. The Streamgraph gives me a great ability to truly explore lots of data in a visual that literally fits my small laptop screen. #awesomeness
If you are interested in exploring simple Streamgraph examples, our lovely friends at Microsoft Research have made it easy. Please visit their site on data visualization apps for Office, and download the app. They also have an app for Treemaps, and it includes using color, as in the Compete case, to represent a metric (say Conversion Rate)!
Another excellent resource is the Google Chart Gallery. Trust me, you'll be impressed with what you can do very quickly. Candlesticks, Scatter Plots, and Sankey charts! Don't forget the Sankey!!
In the next two stories, I want to share three examples of visuals that made me think. I'm hoping to spark some ideas in your head as to how they might inspire you to do something different. Please share your ideas via comments and help all of us learn from you. In the last story, we'll go through another visualization exercise and end with a bang.
Short story #4: Multi-dimensional Slicing and Dicing!
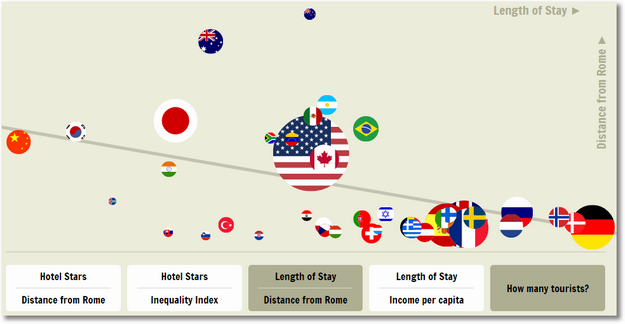
This example is an interactive visualization on Luxury and Foreign Travelers in Rome.
On the x-axis you see the hotel stars (1-5) where the tourists stayed, and on the y-axis you see the distance of their home country from Rome. It is pretty nice.
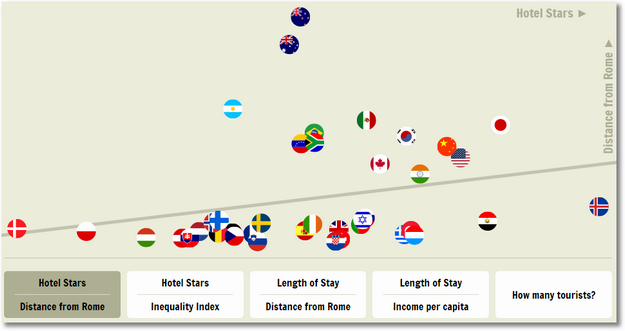
It is easy to see the outliers, countries that are bunched together, and wonder if you need to find a job in Iceland as they can afford four-star hotels much more than others!
You can hover the mouse over any country and get a bit more detail about why they hold the position they do along the trend line.
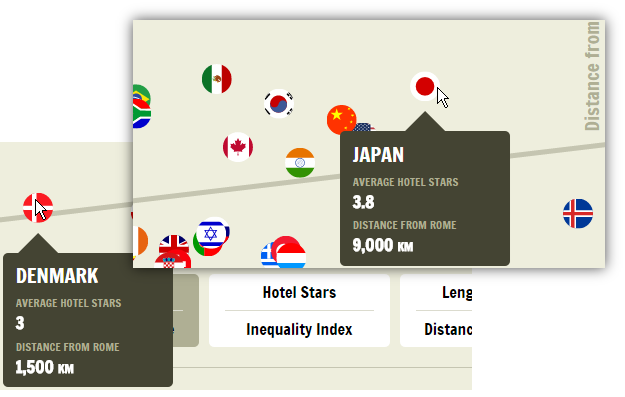
What is cool about this is that we can switch the dimensions we are looking at quite easily to arrive at a more sophisticated understanding of what is going on.
Let's look at Length of Stay and Income Per Capita. Do people from richer countries stay longer in Rome?

Korea (blue, red yin-yang flag on the left) has a income per capita of $31,000 per year, but people stay a lot less than the wonderful Russians who make a lot less. And the Koreans stay for a shorter duration.
You can find the Greeks and the Swiss very close together on the chart now. You can see implications on marketing to individual countries if you are the Rome Tourism Board.
I like the option to slice by inequality index rating of the country (GINI rating).

It is a little surprising at first glance that countries with very high inequality move to the right. China, South Africa, Egypt. Or, maybe it is not surprising (the outliers from those countries would stay at nicer hotels I suppose.
I like the last option the best. How many tourists?

If you were the Rome Tourism Board, now all the sexy fun starts! You can understand your tourists better, you can make more precise decisions about your media spend, the color of the red carpets you might want to roll out, the languages you need to teach translators or wait staff at hotels. And so much more.
You can possibly send this type of a self-contained dataset to the VPs and the C-Suite of a company. But it is perhaps best created for the Directors and people who are making quarterly, six-monthly horizon decisions. It is not great for day-to-day tactical analysts/optimizers/marketers.
You can see it's power for executives under the C-Suite to slice and dice, bring their own business knowledge and context and help make more informed decisions.
So. If you could create this type of an environment for your digital existence, what dimensions would you use? What would you like to plot? If you were an SEO, or ran all Ecommerce for your company, or were responsible for consumer experience?
My initial thought was to have Channels are the plotted dimension (where you see Country). Average Order Value, Assisted Conversions, Bounce Rates and % New Visits. The last choice (How many tourists) of course would be Unique Visitors (for the same reason).
What do you think? What would you do?
Short story #5: Segmented Stacked Square Charts.
Another example from my beloved New York Times. This time it was about the elderly, and their challenges of people who live longer in bad shape. Bracing for the Falls of an Aging Nation .
[Regardless of your age, this is extremely well worth reading – for the benefit of your parents today and yourself in the future.]
There was something mesmerizing about this graph that was in the article…
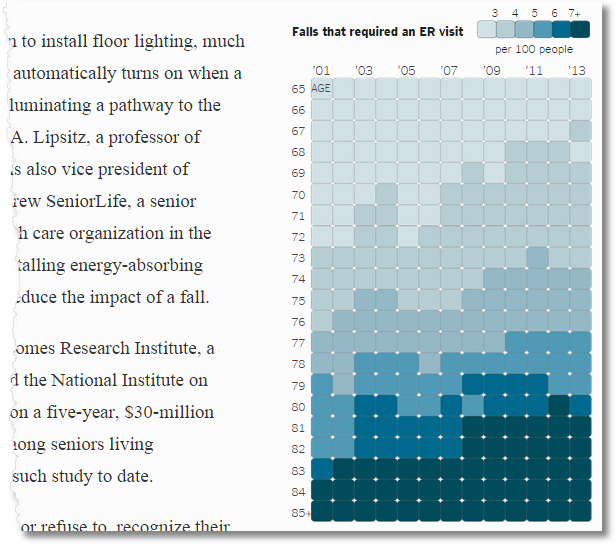
I admit it took a few minutes to figure out what was going on. The non-normal placement of the starting point of the graph might have been it. Or the shades in the legend. But it did take a few minutes.
I came to like it very much.
It shows some obvious things. The older you are, the more likely it is that you will have more falls and visits to ER. The fact that we had this step change suddenly in 7+ in 2008 gives you a pause. Then you can see that what likely happened is that the 6 became 7+. What happened? (The article shares some ideas.)
Overall everything getting worse and, sadly, these incidences are happening earlier and earlier.
I do like this as a nice stacked bar graph that includes a very relevant segmentation, broken into small squares for a nice effect.
If you had to use something like this at work, what would you plot?
I think people don't worry about multi-session conversion enough, they don't obsess about people enough. It is so silly but they are still obsessed about single session conversions! Makes me mad. [See: Multi-Channel Attribution Modeling] Hence, I would plot calendar quarters on the top, channels on the y-axis (not a number), and assisted conversions as the squares for each channel.
What do you think? Good idea? Crazy? What would you do?
Let's close on a let me inspire you to really do this so that you will rock a lot note.
Short story #6: Conditional Formatting, Simple Strategies To Drive Big Focus!
We started with a table, global oil consumption, let's end with a table too. The magnificent Information is Beautiful site recently shared this lovely infographic: What is the world's biggest cash crop?
The right answer to any such question is…. It depends. Always, it depends.
The first visual shared on the site ran off this table.

[Among many other things, one thing I deeply appreciate about the site is that they almost always share their . This means that I, and you, can always download new real world datasets to play with to perfect our own skills.]
Experts that they are, this is their wonderful visualization of the above data…

Depending on your definition of success (planted, yield, production or revenue), your answer might be different. Most people might be surprised that cannabis/marijuana is the grand champion (astonishing considering it is barely visible in the first three columns!). Poor cocaine, so roundly defeated! And good old rice, not very far behind. Go, rice, go!
So many interesting things going on here, look at Sugar Cane.
But that is not why I wanted to close with this story.
The point I wanted to make is that when we seen the work of such amazing artists like David McCandless and his team, it might seem like they are working at an unattainable level. Ok, yes they are. But while you and I, normal people, can't get to their level, we can do more than we might otherwise imagine.
We should try. We should find inspiration from them and we should see what we can do with the tools we have access to.
In the above case, thanks to the table quickly dumped into Excel, we can use the same strategy of using Conditional Formatting to create our version of the above graphic.
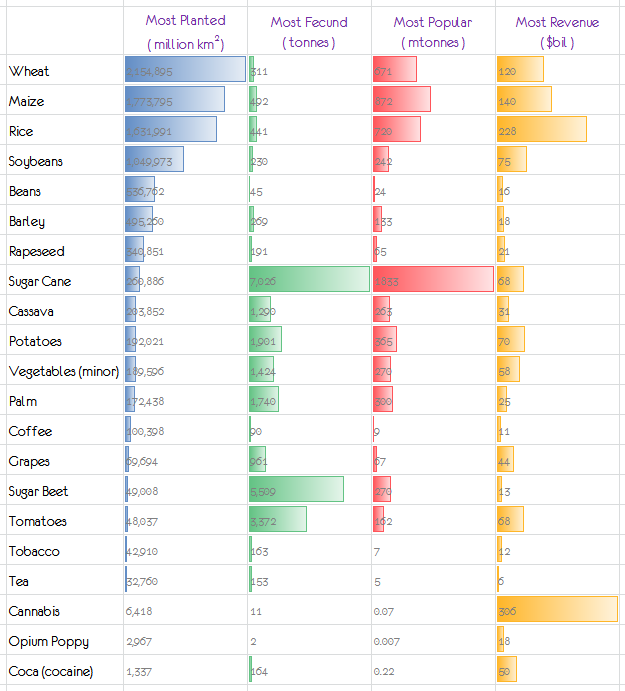
Not too bad for ten minutes worth of work. We even made the column titles smaller! :)
We can experiment with different options at our disposal. This is purely a matter of taste, but I thought the Data Bars lead to a better visual. The green intensity drags our eyes to handful of cells we need to look first. Wheat. Sugar cane. Marijuana!
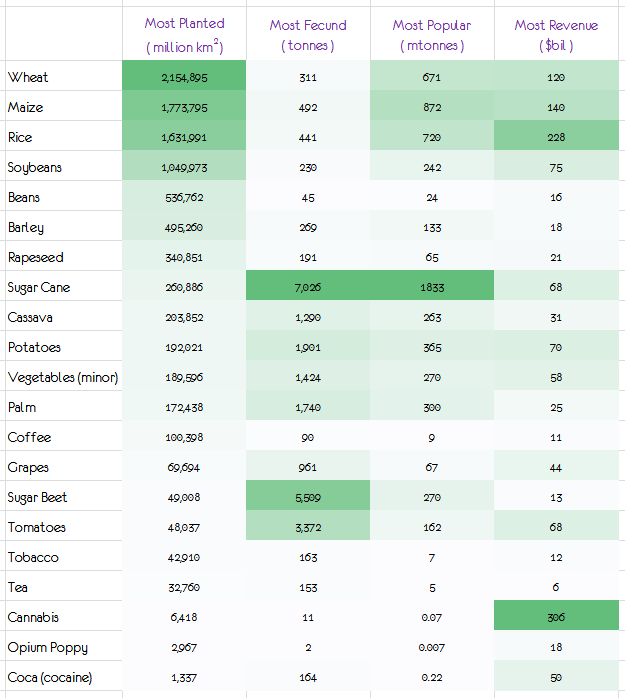
All of the other numbers are there, but they are invisible, even as you can see them!
I see you are complaining that you don't like my table with all the white space and lovely row sizes. And you don't like black font. And you want it all to fit in one page. Happy birthday!
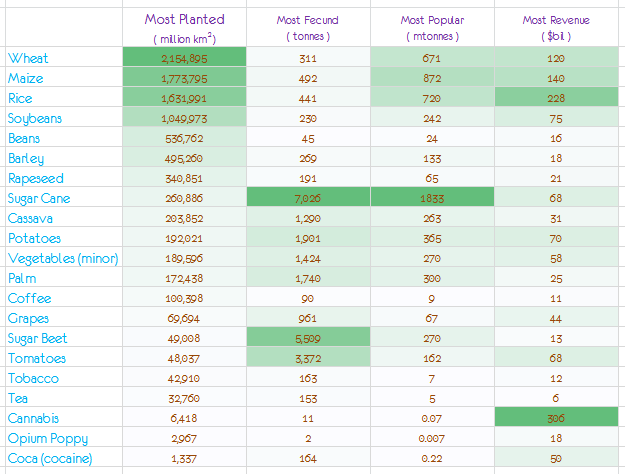
Still works.
David and his team actually took this a couple notches higher and created a nice bubble chart with Revenue. This is the end-state, and it is so nice…

It is harder for us to create this with our normal tools or do it quickly. But you and I can do a lot more than we might believe. Yes the infographic will be shared a lot more in social channels. For us though, the table might work just fine.
I encourage you to go the extra mile, not give in to the default outputs in our digital analytics solutions, to find inspiration outside our space, as I did in all examples above, and get better every day at communicating our ideas more effectively.
We've moved beyond our obsession of data capture, escaped the time suck of data reporting, we are getting better every day at data analysis. This, data visualization, is our last frontier. The last thing between us and the glorious glory to be achieved by driving intelligent, fast action based on our insights.
Carpe diem!
As always, it is your turn now.
First do please share with all of us your ideas for what you would do with examples four and five. And then… How much time do you, or your team, spend on data visualization on a day-to-day basis? Does your company allow you to have the time to think and try various techniques? What are some of your favourite data visualizations for digital marketing and analytics? Are there resources you use to learn that you would like to share with all of us?
I would love to hear your ideas, critique, life lessons, specific tips and inspiration from this post.
Thank you.


 Via
Via 



Hi Avinash –
Many thanks for this post. It comes timely in my own reflexion for the best way to communicate the potential impact of CRO on a business' bottom line. I have not yet played with data visualization per se but your examples definitely gave me some ideas to play with in the short-term :-)
Just a side comment on your tables to present the impact of CRO using the loss-aversion cognitive bias (short story 2). In my (limited) experience, the higher you go in the hierarchy of HiPPO, the more stubborn they are in insisting to A/B test every recommendation, even the "straight forward in the stop the bleeding category that can be fixed without much thought".
If those recommendations are coming from an external consultant or agency like me, then they want to A/B test everything even more strongly, and don't take our word for it. (Of course, for website breakages, etc. no need to test, and the reverse is sometimes true with CXOs used to taking shortcuts everywhere.)
The parameter that is missing from your table in my opinion is the time to complete an A/B test given the performance gain realized at each line. This can be both used to
1) skip A/B testing for really obvious stuff that shouldn't be delayed until testing is complete
2) enhance the urgency to move, if not to the implementation phase, at least to the testing phase: if your test to move from a CR of 3% to a CR of 3.5% will add 10M of annual revenue but will take 60 days to complete, then you'd better start testing now if you insist on testing…
Calculations are maybe less straightforward for this aspect but are still simple. I actually made a simple online calculator which I tell early prospects (that don't want to share their analytics data yet) to use to see how much time a test on their most popular pages/elements will take to complete. Available here for those interested: https://marktisans.com/ab-testing-strategy-planning-calculator/
But when "selling" CRO to execs, I nearly always get requests to test everything, and the next request is "how long will this take?". Then you negotiate what to test ;-)
Best,
– Julien
Julien: I'll add to your wonderful experience with a couple of observations from my works with senior executives.
I've found that when the executives insist on testing everything, regardless of scope, there is a big trust problem. Either they don't have confidence in the team around them or they have not prioritized digital optimally.
Neither is a problem that my predictive model will solve. They simply don't trust me or you or the people around them.
My strategy then is different. Figure out what it takes to earn trust. At times this is to make small changes and show impact. Other times it is about asking them for their biggest challenge and solving that. At other times still, it is taking the biggest cost center and showing cost savings (rather than revenue increase which needs more money). Sometimes it is taking a hard look at the team and changing players. The strategy is different and reliant on the unique situation. But if they ask me to test everything, something bigger is wrong and worth addressing head on.
I do love your idea to add a time frame, and in the discussions we have with this model we present the time frame to impact on the business.
Thank you so very much for sharing your calculator!
Avinash.
Hi Avinash –
You're perfectly right :-) I think this is due to the fact that, most of the time, I am hired in times of need and there is indeed a lack of trust between the client's organization and its external providers and sometimes within the the organization itself.
I fully agree with you on the wide palette of solutions available to solve this, but sometimes the easiest path for me is just to say: "ok, well, let's test this recommendation, it won't increase your CR by 20%, but you shouldn't see negative results either. Worst case should be no impact." The catch of course is that these tests will take some time to reach the required minimum sample size, since the likely impact is small.
That's when being upfront about the times to complete can lead to either more trust and less testing or at least a clear expectation that they'll have to wait a month before seeing any results either way on this first test. It's frustrating for sure, but sometimes it works well to rebuild trust within the client organization. And writing that I realized this is exactly what you meant by "make small changes and show impact."! :-)
Best,
– Julien
Long time reader, first time commenter. :-)
Thanks for sharing the news about treemaps, which I've considered a secret weapon for many years as a web analytics visualization powerhouse. I like them so much I've coined a better name for them: Brownie Charts. Why? First, treemap is confusion. Secondly, they replace pie charts and donut charts. And third, when there are relatively few items shown, the sort of look like a randomly cut pan of brownies.
I'll linked to my story about brownie charts, featured on @jasonfalls site.
It's obvious that the US consumes more oil than Egypt.
If we normalize oil consumption by population what happens to the chart? Or, perhaps we can make some measure of efficiency and normalize oil consumption by GDP?
Corey: Yes. That would be something interesting to look at.
In this case our friends at Stats Monkey were simply trying to show raw oil consumption, and in that I feel they succeeded.
One idea I had for them would be to consider using colors in the Treemap view to show increase or decrease in consumption of oil. That would be so interesting, and take us down a lovely discussion.
Avinash.
Another great use for sunbursts is to visualize multi-channel funnels. If anything, you can see right away that there is more to last click attribution.
http://www.michaelwhitaker.com/2014/03/19/multi-channel-funnels-d3/
Michael: I love it!
I use the Sunburst for keyword clusters primarily and for the MCF analysis I use the Chord which takes out some of the intermediate steps but helps visualize the starts and the ends much more effectively across channels.
Something to share with you next time we have lunch.
Thank you for sharing your example, it really is cool.
Avinash.
This post is already 5 years old but it still inspire us who have just started with Marketing Analysis.
@Michael, unfortunately there is an error while opening your link. Is it possible for you to share your visualisation once again ?
@Avanish, did you write somewhere more detailed how you do the keyword cluster analysis with help of the Sunbursts ?
Thank you very much Avanish, all your work is incredible and inspiring !
I like #1 and #5.
#5 (also called heat map) is applied also in Google Analytics App and also very famous infographic for know "which birth date is more common". Just type this statement in Google Search and see what you get (and also click on result).
I found #5 very useful – see which days and hours bring more users or when day make more purchases.
You can call me old-fasioned but I am not a fan of such of this content visualizations. I like my text to be plain and made of words not pictures – but that is only my way of thinking.
But as a copywriter – great work you have done here! :)
Mick: That is quite ok. Next time I write a post, I'll make sure I include word clouds. I'm confident I'll win you over then!
On a serious note, and your stress on text… I am a very big fan of stressing the value of IABI (Insights, Actions and Business Impact). And it is all expressed in English. Our visualizations, like in this post, make it easier to get to the IABI, but in the end it is the English text that is key.
See the two triangles at the start of this post: Smart Dashboard Modules: Insightful Dimensions And Best Metrics
Good luck!
Avinash.
TY for your response :)
You have already won me over! ;)
Maybe that day I was not in the best mood. Now when I have looked one more time on your content I can clearly see that with good graphic it is more entertaining and interesting for the reader.
I was more thinking about the present trends when even big publishers do not posts articles but slide-shows with short descriptions. I hate that!
Hi Avinash,
I like data visualizations!
A really in-depth and insightful post with a great statistics and charts. Great job!
What an amazingly detailed post, thank you Avinash. Eight years on, you continue to rise standard for what a quality blog post should be.
My application of story four would be to show content categories as the dimension. I would use unique pageviews for size of the bubble. The metrics would be time on page, bounce rate, page value, page load time.
That combination would help our team do effective content analysis. It would be easier than trying to put it all in one table in our Adobe Analytics implementation.
Appreciate the inspiration.
Daniel: Ohh… that is an excellent idea! I'd not thought of applying it to content categories. I think it would work quite well.
I'm off to try it now. Thanks for sharing your wisdom with us.
Avinash.
I love the call to arms Avinash!
Our teams have a difficult time justifying an investment in people or training when it comes to specialized dataviz skills. You've helped me identify that a part of our problem is that our current work does not live up to the spirit of this post. We are going to look at our day-to-day work with these new filters.
The other part of the challenge is all the internal politics. That is something we will try to take care of ourselves, unless you want to help us out by writing a detailed post. :)
Hi Avinash, Your post combined with these amazing tools prove that analytics don't have to be boring. As you have said before it all comes to what we do with the information.
It is our job to make analysis something fun and useful!
Brilliant article…this is immensely useful to grab attention from the c suite.
Can you please let know the tools used in multidimensional scaling and segmented stacked square charts.
Raja: I'm glad you found the post to be of value.
In both of those cases the sources created custom visualizations using in-house expertise. To the best of my knowledge they are not available for us to use.
But I've linked to Google charts, D3.js, and NVD3 in this post. In those sites you will find numerous amazing examples of visualizations you can use. Please check them out.
Avinash.
Great examples Avinash!
Thank you for including all the tools and resources. They will be extremely helpful in my evolution from a sender of data to engaging our senior leaders with attractive simple visuals.
I'm going to try the stacked square chart with years at the top, conversion rate on the side and average quantity ordered in the shaded squares. It could be quite interesting.
Hi, thanks for this amazing post.
It will help me tremendously with my job.
Hi Avinash
As usual , a great post and very engaging. I liked the way you summed up No pain = inaction.
I was trying to figure out D3.js ..honestly there is lot of coding text. How to "create" these charts for my data from these sites , is something i have not understood. If you could explain that briefly would add value to me.
Thank you
Akshay
Akshay: I'm afraid you do need a certain amount of technical skills to use the wonderful stuff off D3.
But a quick way to start might be to use the examples gallery off NVD3: http://nvd3.org/examples/index.html
Avinash.
Thanks , Avinash, for your prompt reply. Will play around.
Great post. I'm a sr mgr at SapientNitro in the performance marketing and analytics silo and data visualization is a HUGE aspect of what I do.
When clients are paying millions of dollars for a service, they want things THEIR way – a large part of that is finding new ways to present the SAME data set. Different ways to present that difference go a long way, as I am sure you are well aware of.
When we are doing a keyword analysis for an SEO/SEM client, we present it in a TREEMAP. When you are working with a Fortune 100 client that has thousands of potential target keywords, the best way to present that data is in the form.
I strongly suggest others look into this as well – it's an extremely effective model.
Ryan: I can appreciate the difficulty in trying to convince an organization, big or small, to be open to new ideas from an outside entity.
This post might be of value, lots of ideas there about how to change cultures:
~ Empowering Analysis Ninjas? 12 Signs To Identify A Data Driven Culture
Appreciate your wonderful idea too! Another one for Search is to create logical keyword clusters and then use the Sunburst to visualize the customer journey to Macro or Micro Conversions.
Avinash.
Hi Avinash,
Thanks for the great article.
Data visualisation as a field is growing fast and more companies are becoming aware of it's true potential. But there is a long way to go.
Some reasons why data visualisation hasn't really taken off
-Lack of skills and training
-Most often data visualisation is left to technical people to decide. Whereas business user participation is more critical. And also there is a poor collaboration between business and technical users.
-Management is reluctant to move away from what they're used to and hesitant to invest
What the companies can do
-Deploy massive trainings to develop visualisation skills. Conduct Advanced Excel trainings (Excel is more than enough as a tool in most of the cases)
-Stop treating data visualisation as an afterthought and make it an essential part of regular reporting and analysis.
Thanks
Shivaraj
Brilliant article!
Your comment of "If you wonder why sometimes governments move so slowly, among the many other reasons, attribute some of the blame to the power of communication" – So very true!
Big machines with lots of cogs to keep the wheel moving will almost always have an issue with communication.
Nice work.
The Excel charts can look a bit cluttered with the values overlayed on the charts – a solution is to hide the text.
Use this trick in Excel: Set the number formatting to Custom and enter ;;;
Like magic the values disappear and your visualization is less cluttered. If you need to show the values, they will look better in their own separate column or table.
Cheers,
Chris Marsh
Hi Avinash,
Thank you for the informative post. I love your work.
What do you think of the Google Analytics new Treemap reports for AdWords?
Kayleigh: They are a wonderful addition!
These lovely folks did a great job of capturing the possibilities of reports you can create, with pictures: http://goo.gl/IGEAFu
And here's the official, but boring, help guide: http://goo.gl/YfjGMA
Avinash.
Hi Avinash,
That blog post is really useful, I also wrote a similar blog post when we noticed it in the UK http://goo.gl/NvwiU1
I definitely haven't got such a cool header photo though! :)
I'm looking forward to more visual reports in the future. I think, as you said, its such a great way of displaying huge amounts of data in a small space.
I tried to write about the limitations of the Treemap reports but one thing I don't think I emphasised is how the relative colour intensities of the report could make it potentially confusing for clients if you were comparing two side-by-side. I also think it would be helpful to be able to choose which goal you want to calculate the conversion rate against. But I do quite like them for the fast top level overview it can give, and I think it can help clients ask us the right questions too.
Kayleigh
I always love your posts, but I don't comment often.
An interesting thing you won't see in the graphic about the Oil Consumption is the consumption per person by country, but it would be very interesting. You can do the rough math and realize that the US with the most consumption at 19 million barrels per day and only 300 million or so people seems like we are definitely the biggest consumers of oil of any nation in the world, but maybe we're not?
If you annualize this data it's even more interesting to know that in the US alone we consume about 7 billion barrels of oil per year and that is one barrel of oil for every human on the planet to drown in.
I'm glad I drive an electric car but it doesn't really make a difference considering all the oil used to create the food I eat, the roads I drive on, the internet up and running so we can use Facebook and Netflix… we are an oil based society and there's very little one can do about it, but together it seems we could do anything we imagine.
Neal: I appreciate the editorial. :) I'd had a Nissan Leaf for the last three years, I'm now on an all electric RAV4 (cheap way to get a Tesla!).
But the analysis you kindly share is beyond the scope of the graphic we covered. Would be interesting to do though.
Good luck!
Avinash.
Wow what an amazing post to sit down and read all the way through.
Data visualization is something that is often overlooked and your post points to how effective it can actually be! My colleagues and I will have to spend more time on it :).
Data visualization and correlation mapping is the core for so much of what goes on in today's technology world.
Great post thanks for the details. Loved every bit of this.
Thanks For posting a detailed review on data visualization analysis.
It helps me a lot where i can learn more information from your post.
Keep posting on more interesting topics
First of all I would like to say sorry for my bad English below. I'm not a native speaker.
Second: Wow! I'm realy excited about your post. You have to know, it's my first visit on your blog….and I felt in love with it immediatly. Despite it was 5AM, when I was ready with reading this article yesterday, I wanted outright to start with creating some nice charts. :-)
I am currently at the end of my study in marketing and business informatics at the university in Berlin. Furthermore I am working as a student emploee in the web analytics department of a middle-sized company for laying the foundation for my career at this industry. My main tasks are to monitor the web with econda, some further things of data analytics, create a lot of various reorts and, e.g, conduct & present some market researches.
Thanks to blogs like yours I am full with new great ideas, which I would like to integrate in my everyday work. But there are some issues between theory and praxis.
1. This company utilise MS PowerPoint for their presentations. Is there a way to empoly your ideas of creating charts in PP?
2. We issue a whole pile of different reports, which – I'm afraid – aren't neaded or even read by nobody. Perhaps you have some general ideas, hints or recommendations (for appropriate articles/blogs), which can help me building awereness of the importance of data driven decision making.
Of course I won't chage the entire company – So maybe you have some small ideas for me for the everyday work or for widening horizons of my direct supervisor?
I would be most grateful if you would anwser me. :)
Kind regards,
Andreas
Andreas: Your English is fine!
1. All the visualizations in this post were created outside of Powerpoint. Some used Excel, some used data viz websites (like the treemaps I created in the post) and others used javascript (for example, d3js.org, nvd3.org) and others using custom software. For the former you don't even need a lot of experience, just follow the instructions in this post, and for the latter do need some coding skills.
2. You are producing what I tend to call CDPs (Customized Data Pukes). Sometimes these are necessary. If you can, I recommend converting them from CDPs to tactical dashboards. If you want examples of what should go into those tactical dashboards, or even nicer CDPs, please see this post: Smart Dashboard Modules: Insightful Dimensions And Best Metrics.
All the best!
Avinash.
Hello Avinash,
thank you for your fast reply (an the compliment)!
1. Ok, good to know! So additional to improving my English, a lot of interessting issues in the web analytics world itself, SEM, SEA etc. there is a further field which tempts me…Briefly said: Unfurtunately there are way too much thrilling things for too little time. How about a 36 hours day?
2. Yes, "CDP" hits the bulls eye. The tactical dashboards could be worth a try, even though I don't believe in big success.
Best wisches!
Andreas
Hi Avinash,
If you ask me, one of the main reasons for the Big Data boom is the use of data visualization techniques to make the information more accessible and the decision making process much quicker. I like the way you implemented some of these ideas in the online analytics domain. It would be great understanding.
I analyzed in my modest blog the set of ingredients you need to "cook" of an effective visualization
Have a look if you are curious about bigdata-doctor.com/monet-picasso-seurat-decision-making-ready/
Hi Avinash,
Again a great post with lots of in-depth research and data.
Thanks.
Thanks for the thorough post on data visualization.
It is interesting how the way in which we develop our data influences the message.
You're a whiz! Thanks, Avinash.
That's a very insightful post Avinash – thank you for laying it out so clearly and in-depth. I have already registered on infogr.am to try it out. I think it's a winner already – my blog visitors will love it.
I didn't realize how much more impactful it is for the viewer when presented data in this manner. It really does make it more interesting and fun!
Very well written post on data visualization.
Your in depth research is clearly visible in this post, very impressive.
Hello,
Great post. That was nicely written. I really enjoyed.
Thanks to share this post:)
Regards,
Sonam Gupta
Hi,
I like this post. This is the great thing about data visualisation.
As we know that most often data visualisation is left to technical people to decide. Whereas business user participation is more critical. And also there is a poor collaboration between business and technical users etc. We try to solve this problem.I will pass it to all my followers.
I would love to see some more such interesting article from your side.
Thanks for writing and I hope that you’ll have a happy weekend.
Keep up your great work!
Regards,
varija tripathi
I am very impressed with your analysis and approach to data analysis visualization.
Please keep the good articles coming!
Ted
I enjoy your blog, so I’m just playing devils advocate here to get a different point of view.
Visualizing data looks flashy and nice on the surface, but it does not offer in terms of actionable information. The older I get, the more likely I am to fall on ice. Great, I could of guessed that! Average T.V. sizes have increased in size over the past 10 years however they are plateauing around 42inches. All these fancy charts and time spent visualizing mundane and useless information.
How can we use this to find useful information? How can I visualize data in a way that will allow me to see some interesting trends that I won't get from a standard report inside google analytics?
Nelson: I do apologize but I'm not sure what you are playing devils advocate about. :) That we don't need to find a way to visualize complex data simply. Or your frustration that you only have mundane and useless information?
Let's say you were trying to play the devil on the latter. You are right. If all you have is mundane or useless information (let me throw in, wrong information in there), then you don't need to find a way to visualize that data simply. You would only be putting lipstick on a pig.
But. If you do have information that is interesting and of value to the business. But it happens to be too much, it happens to represent complex scenarios, the trends and patterns are not obvious, and on and so forth, then data visualizations can be helpful to get to the insight faster.
This applies to my last two treemaps (gets me to my acquisition insights faster). It applies to my Impact Analysis (the pain of no action). It applies to my streamgraphs (there is no other way to watch hundreds of thousands of row of data).
So. Data visualization helps you get to the insight faster – from data that is interesting and useful in the first place.
But in my IABI formula (more here: http://goo.gl/PFGyKG) it is only the I. Our job then is to figure out what Action to recommend, and along with that compute the Business Impact as well.
-Avinash.
Thanks for the detailed analysis.. I would love to see some analysis like this for VC funding in Silicon Valley.
Also, I think this might be a useful tool you could use in the future for creating charts/infographics.. Most of the charts here are a very good candidate for infographics. http://piktochart.com
(Ps: I am not an affiliate of that product)
Hello Avinash,
Excellent post.
Hi Avinash,
Great article! Learning a lot with you.
I have a dumb question, how do you get the "monthly Incremental Value"?
Thanks!
John: Not a dumb question!
Refer to the table above. You calculate three things…
First, the total number of leads received received under the improved conversion rate. (For 2.5% it would be 37,909.)
Second, you compute the Incremental Leads received compared to original. (37,909 – 19000 = 18,909)
Finally, compute value from the incremental leads. (18,909 * $238 = $4,500,271).
Rinse, repeat!
Hope this makes it clear.
Avinash.
Avinash,
This is fantastic and some great examples which show the magnitude of change or impact of a number in comparison to others.
I always struggle to understand why more of these visualisations are not used more often. We all talk about be time poor yet I still see people presenting excel or tables (short story #1) which ends up taking time for people to digest and then discuss when in fact there is a simple point to be made.
I wrote a piece about the likeness of racing drivers to CMOs and love to hear what you think (cmo.com/articles/2014/9/30/what_do_cmos_and_rac.html)
Neither have a lot of time on their hands to make decisions, but both live in an incredibly rich data environment.
So why oh why do we feel we have to present all the data we have and if we insist on presenting all of it, why isn't it clear and simple.
Love the blog!
Ben: It is a lovely metaphor. Providing a simplified version of reality (instead of a data puke) is absolutely mandatory.
I recently reflected on the challenge of dashboards in this post: Digital Dashboards: Strategic & Tactical: Best Practices, Tips, Examples
My key learning has been that arguing about how much data tends to obfuscate what's actually needed to win. In the post you'll see the challenge represented by the two triangles.
My solution is to force analysts to spend 80% of the time spent on dashboards on the qeust to identify the IABI. The CMO does not really want the data (unless they fundamentally don't trust you). They want to know what to do, and they don't have the capacity to identify what. Hence, strategic dashboards should have IABI. Else, they are simply CDPs (which tactical dashboards can be, but we have low expectations from them).
Thank you again for sharing your lovely post, and wonderful metaphor.
Avinash.
People looking for advice about dataviz should read Show Me The Numbers by Stephen Few.
While I love Data Visualization myself, it is very tough.
Some of the charts you have listed above are great, but still busy and hard to digest.
When complex data is needing to be represented it can become harder to visualize.
I am a fan of simple numbers.
Not really, I am more of a fan of complex data, but I am a fan of presenting data as simple numbers.
John: I think there is a happy medium between drawing on complex data to present it as simply as possible.
I'd recently covered that topic in this post: Great Storytelling With Data: Visualize Simply And Focus Obsessively
I hope you'll find it to be of value.
Avinash.
Thanks for sharing this article. It is going to be very helpful.
We are currently working on optimizing our agencies website at http://AcumenStudio.com and thinking through how we can populate data that is easy for most to digest, but still be substantial enough that it makes an impact.
Right now we just have a "pretty" layout, but we need to finish some technical optimizations as well as format and simplify the copy.
Hi Avinash,
For the first ever time read you write up and totally loved it. A greater compilation on data visualization analysis. Keep writing up such informative posts. Kudos!
Best Regards,
Annie
Hello,
I have been using treemaps at my organization to display chart completion by physician data. It has been a great method to communicate this information as it allows us to see what proportion of charts are completed by each hospital department, but also how each department is performing. This visualization has allowed us to identify areas where improvement initiatives will have the most impact.
I have recently been trying to find a way to adapt my treemap so that it is also able to show performance change over time.
Any suggestions – or is there another form of data visualization that might be better applied to this?
Bethany: My sincerest apologies for the delay in replying to you. For some reason your comment was stuck in the spam folder.
One idea you can explore is Motion Charts. They allows you to explore five dimensions.
Here's a post with a detailed explanation:
~ Better Know a Visualization: Motion Charts
And here's one on how to create it in Google Charts:
~ Visualization: Motion Chart
Avinash.
It was a bit lengthy but loved it.
Hy Avinash
Thanks for sharing the news about treemaps, which I've considered a secret weapon for many years as a web analytics visualization powerhouse.
I like them so much I've coined a better name for them: Brownie Charts.
Why? First, treemap is confusion.
Secondly, they replace pie charts and donut charts.
And third, when there are relatively few items shown, the sort of look like a randomly cut pan of brownies.
That's really great work from you avinash.
Greatly appreciated the detailed walk through related to data analysis. I really loved it.
I'm off to be an analysis Ninja!
Really nice article.
It gives me many new ideas in how to a way to present to drive more effective action.
If I had to take a singular lesson, it is to strive for simplicity to an extreme amount. :)
Really informative and useful.
Complete insight analysis.
Thanks for the post.
An incredible collection of examples.
It was invaluable to have your take these non direct examples and tie it to how we can use these in our day-to-day efforts.
I know what to do now, thank you Avinash.
Great source!
According to my opinion for in depth analysis data visualization is the only way out to elaborate it properly with easy stats option.
Thanks for worthy content.
Amazing that this article is still useful.
I've taken three ideas that I'm looking forward to implementing.
Hi Kaushik,
Great information sharing post!
I feel for any in-depth analysis or research we require hell amount of data with proper visualization. You article presented this in the right form and the importance of data visualization.
Thanks for sharing this worthy content.
HI Kaushik,
Thanks for sharing this valuable article!
Data visualization is a skill and Here you have displayed that.
Thanks!
Data is a double-edged sword. For one thing, data is extremely valuable and allows you to learn how to improve ads and connect more effectively with your customers.
The not-so-good side of data is that it’s incredibly difficult and time-consuming to extract actionable insights from it.
Sankey diagram is a very useful visualization to show the flow of data..
Great Post,
I like this post. This is the great thing about data visualisation.
As we know that most often data visualisation is left to technical people to decide. Whereas business user participation is more critical. And also there is a poor collaboration between business and technical users etc.
Keep up your great work!
Thanks & Regards!
Priya Singh