Over the last year, the team at Google Analytics (GA) has released a cluster of features which extend GA’s ability to power higher altitude, higher value decisions, along with new value for functions like Finance.
Some of these capabilities are forward only. They collect/process data from the day you turn them on, and never backfill. So… As soon as you are done reading, get to activating!
I’ve picked four (plus three) features that will speed up your conversion from a Reporting Squirrel to an Analysis Ninja. This will get you into more meetings with Extremely Senior Leaders (ESLs). That should translate into more influence [and higher compensation for you!].
1. AEO: The AI Assistant Channel.
You’ve read my mini-book on AEO [TMAI Premium editions #468 > 473]. You’ve taken my Excel based AEO Loss > Recovery > Growth Model [TMAI, 482 > 484]. You have seen my prediction of approx. 20% to 30% loss in SEO traffic come true.
But, until recently the only way to answer is ChatGPT sending us traffic, conversions required a regex. Not anymore, GA answers by default. And, there’s more.
Location: Reports > Acquisition > Traffic Acquisition. Look for AI Assistant in the Default Channel Group. Medium is set to ai-assistant, campaign to (ai-assistant). No set up required on your part.
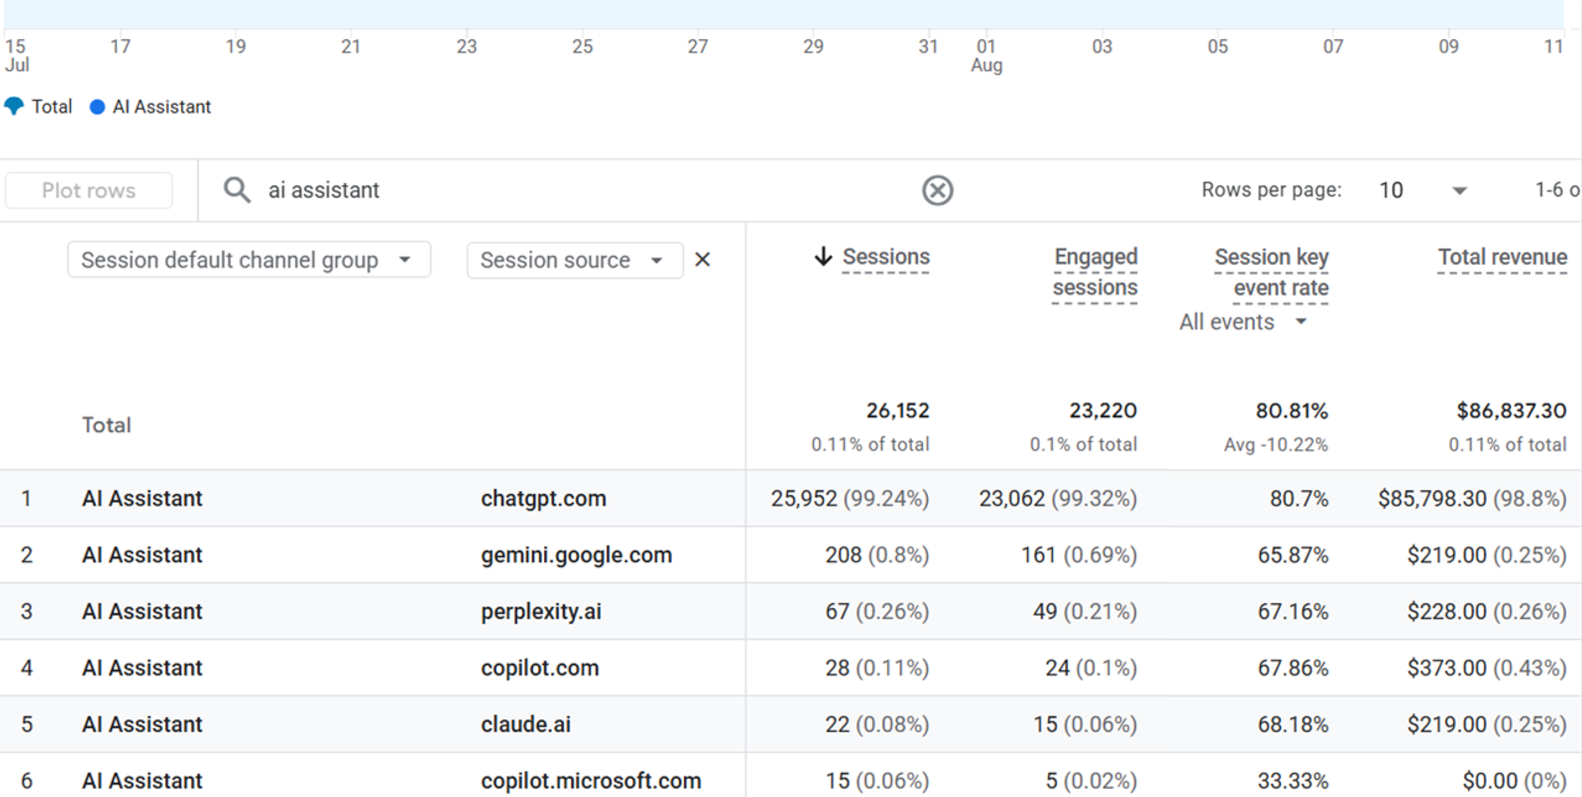
Unless your business is exceptional, your Answer Engine (AE) traffic will be small. 1% – 5%. Reassuring to those who have read my L > R > G AEO series above. Disappointing to those who have not, because they might be expecting SEO down equals AEO up. Sadly, no. Now. You have data.
You are not getting back a big chunk of the lost Google SEO traffic, hence focus on AE driven engagement rate, session key event rate, conversion rate. Unless your business is unique, you will discover that the quality of traffic is much better. Compare it to the Organic Search row in that same table.
Here’s something I find helpful… Where is the AEO traffic entering my site?
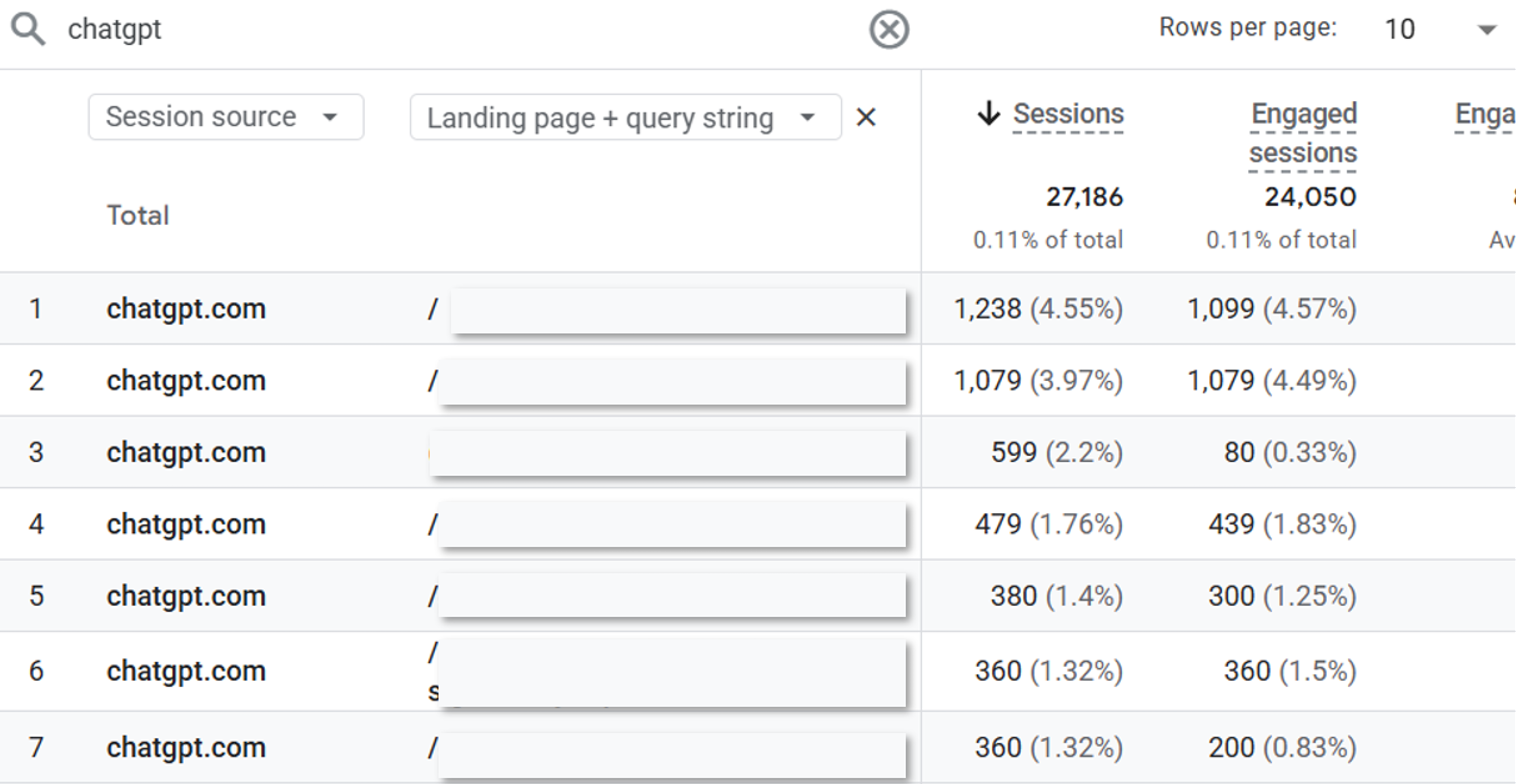
It sheds light on what we are ranking for in Answer Engines, what persuasion or influence is there that is bringing people to my site, so on and so forth.
Adobe in March 2026 said conversions from AEs are 42% better, AE traffic spends 48% more time on product pages [great for offline impact], and 37% higher revenue per visit. Shopify published similar data in May 2026 [50% higher conversions on PDPs, soundly beating Organic Search, and 14% higher AOV].
AEO traffic is more valuable than the count of sessions would indicate.
Higher Order Bit: Answer engine traffic is a couple percent of the sessions, and converts twenty-five percent better. This is not a traffic story. It is a margin story. It is an argument for serious AEO. For referring traffic AND influencing those who might never land on the site.
Real life is in nuances… Cautions:
Data only starts mid-May 2026. No past in “AI Assistant Channel.”
The list GA is using is a moving target. Claude was in and then out by June. Deepseek, CoPilot, and Grok showed up later. Check the definitions monthly before you send your reports out.
The issue with no referrers from mobile apps, desktop apps, in-app browsers etc. also haunts us here. There’s been massive growth in LLM apps. In GA traffic will end up in Direct.
Heartbreakingly, Google categorizes its own AI Overview and AI Mode traffic as Organic Search – though clearly, we would call it AE traffic. Perhaps Google wants to make old Organic Search look better than it might be. ☹️☹️
So… The AI-Assistant row is deeply welcome, and bigly underrepresented. Use it actively, and tag your reports with “Understates LLM Traffic.”
Bonus Gift: Use my Toolkit below to address above issues and get True AI Traffic & Revenue.
2. Conversion Attribution Analysis.
Assisted Conversions are back! Reason #2 for centralizing your MTA in Google Analytics.
TMAI Premium Subscribers are aware of my consistent advocacy of Assisted Conversions KPI as critical context for your Last Click conversions “reality.” [Please see #448 (Smart Attribution), #434 (Attribution to MMMs).]
Feel the difference.
A. TikTok drove 400 Conversions last quarter. Meh. Boring.
B. TikTok assisted 5,300 conversions, it appeared on 33% of the multi-touch paths. OMG!
A means reduce focus on Tiktok. B means a big reassessment of TikTok across acquisition, behavior and outcomes.
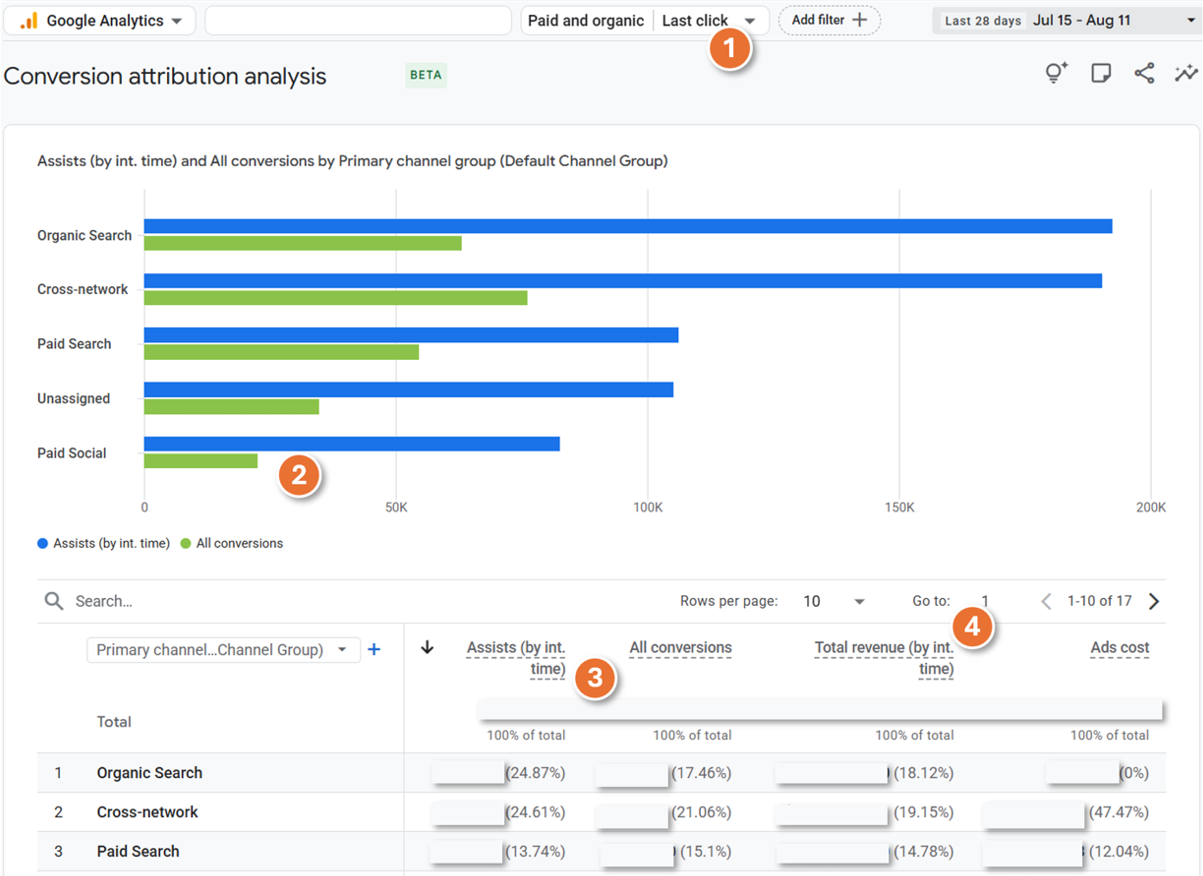
Location: Advertising > Conversion Attribution Analysis. For Assists, set the attribution model to Last click and the attribution timing to interaction time.
Recommended Steps:
1. Pick the model context first, click, choose Assisted Conversions / Last Click.
2. Compare value added by assisting (blue bar above) and total conversions lc attributed to the channel (green). I anticipated Paid Social, but was completely surprised by Organic Search’s assisting role. Like, really surprised.
3. I love sorting by this column, Assists, to remove blinders from Marketer eyes.
4. You will of course pair Assists with Outcomes (revenue) and Inputs (ads cost).
Super cool, no?
Reason #1 to ditch your MTA tool and switch to GA? Much better understanding of each channel’s role in the consumer journey!
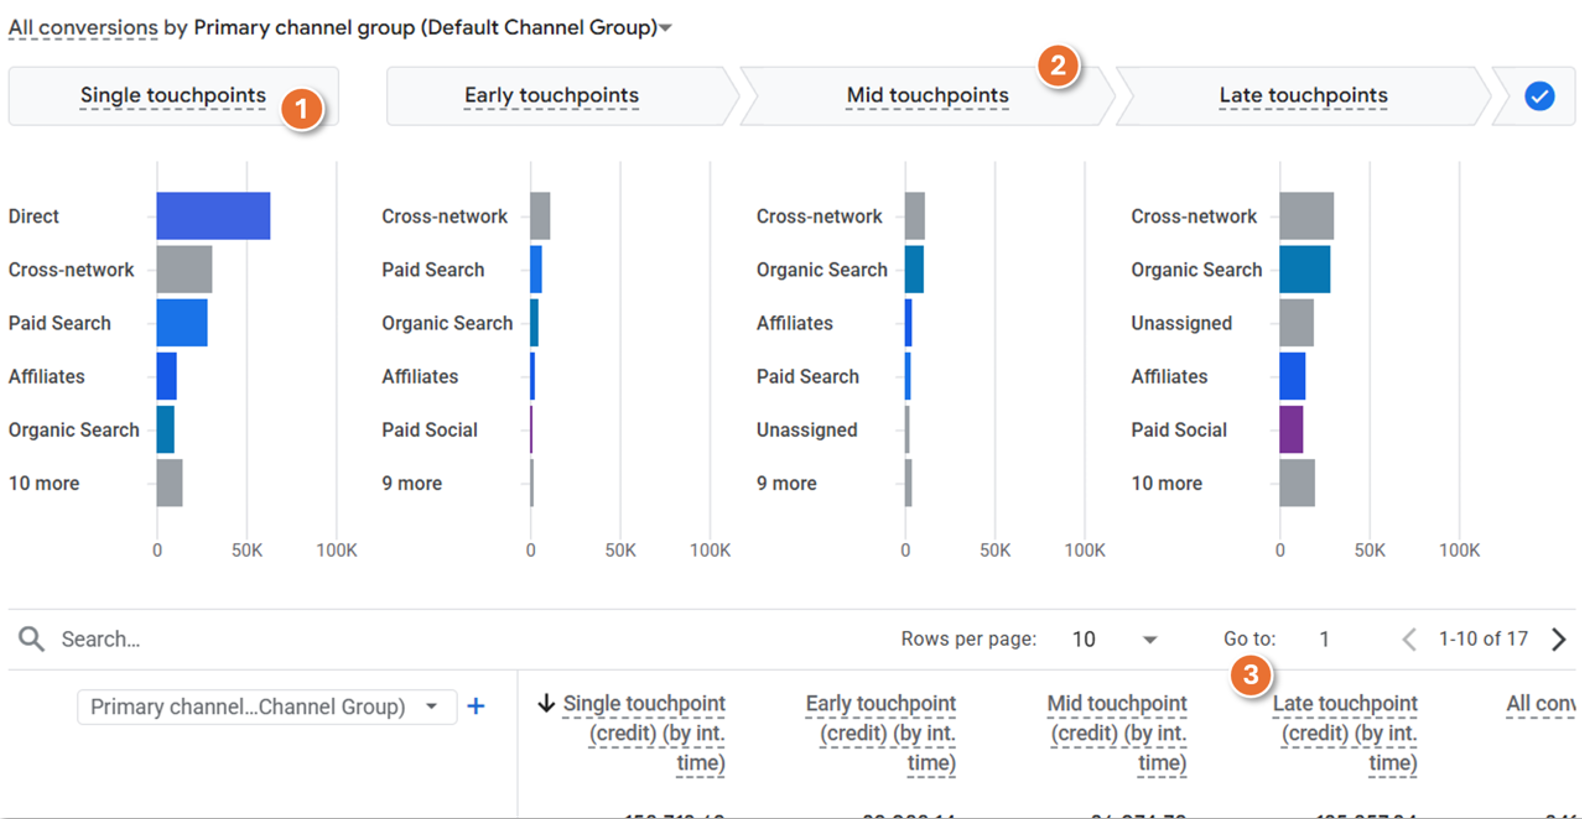
GA uses a refined “funnel analysis” to sort channel touch points (owned, earned, AND paid) into Early/Mid/Late, along with splitting out single-touchpoint paths.
1. Channels that are lone rangers. Notice the placement of Direct, and the busting of the myth that “Direct” is stealing credit from other channels (in case of this biz).
2. Some people use phrases like prospecting, education, consideration interests. Of particular interest here are reflecting on “late touchpoints,” channels that close out complex journeys. (Notice Paid Social here, surprising.)
3. Quantify the share of data-driven conversions credit assigned – at each journey stage!
Identify the undervalued “upper-funnel” channels and STOP cutting them. 😊
For my acquisition conversations I start with this report. It is such a simple way to identify clear actionable paths…
A. These channels are mostly single-point channels, likely targeting pre-convinced intent, perhaps existing customers, perhaps with sweet juicy discount offers, let’s push to discover how much headroom we have and what does VP UX need to do to influence experience customization on the site to 1.5x the conversion rate?
B. These channels are primarily inside a multi-touch journey, sparking influence that will turn into demand. Let’s use Scenario Planning (in our MMMs) to find the diminishing return curves, find the optimal maxima, budget accordingly, brief agency accordingly, measure daily using Assisted Conversion, monthly using BLS (if available), and quarterly using the MMM.
One more super actionable bit: Single-point or Multi-point location should immediately change your Call To Action in the Ad. With a cascading impact on the creative (see: Human Made Machine!).
Play with time periods. Apply “brand” and “performance” segments – normal Analysis Ninja stuff. If your boss asks “are you using AI”? If you follow my recommendations above, say YES!
Higher Order Bit: Assisted Conversions (ACs) are not the destination, Incremental Conversions are. Still, the fact that ACs are available all day, every day, for every channel gives you an intelligent measure that is immensely actionable. Use it.
No more throwing spaghetti at the wall. No more spending on Pinterest or Snap because you have a feeling.
Real life is in nuances… Cautions:
Reminder: Attribution is not incrementality.
You will notice that the total of assists sums to well over 100%. That is by design. Use this report to reorder your channels, please do not inflate your total or imply it.
The Advertising section requires you link at least one Google Ads or GMP account.
I’ve advocated for Macro ($$$) and Micro (“assisting”) Outcomes. Still do that. But, make it a super focused and valuable list. One Macro, that’s your ecom. Four or Five Micro (newsletter signups, software downloads, leads, etc). If you don’t, a conversions set stuffed with micro-events will tell you everything assists everything. GIGO.
3. CMO Convos: Cross-Channel Budgeting.
The gap between email converts at 4.5% and email converts at 4.5%, go from six sends to nine, it will deliver $3m of incremental revenue is the gap between an insight and a decision. It is also the difference between a Reporting Squirrel and an Analysis Ninja.
I’m a big fan of predictive analytics (TMAI #250), and I’m so excited that Google has built a version of this into the product.
Location: Advertising > Cross-Channel Budgeting.
Tool One: Project Plans. They answer pacing. Is spend on track, and what will it deliver at this rate?
Tool Two: Scenario Plans. They answer allocation questions. What happens if I move $250k out of Paid Social into Paid Search?
These models are trained on your history, they incorporate seasonality, and additional factors.
In my Smart Clusters framework [TMAI #224: Analytics On The Bleeding Edge], you learn the criticality of win before you spend. Now, instead of just being in meetings where you present results after the spend, you can start going to meetings with scenarios that help plan the execution strategy WITH predictions of business outcomes.
Or, better still, go with three – one for each team pushing their agenda – and help the business leader make the most informed decision vs. being swayed by the charms of one team. 😊
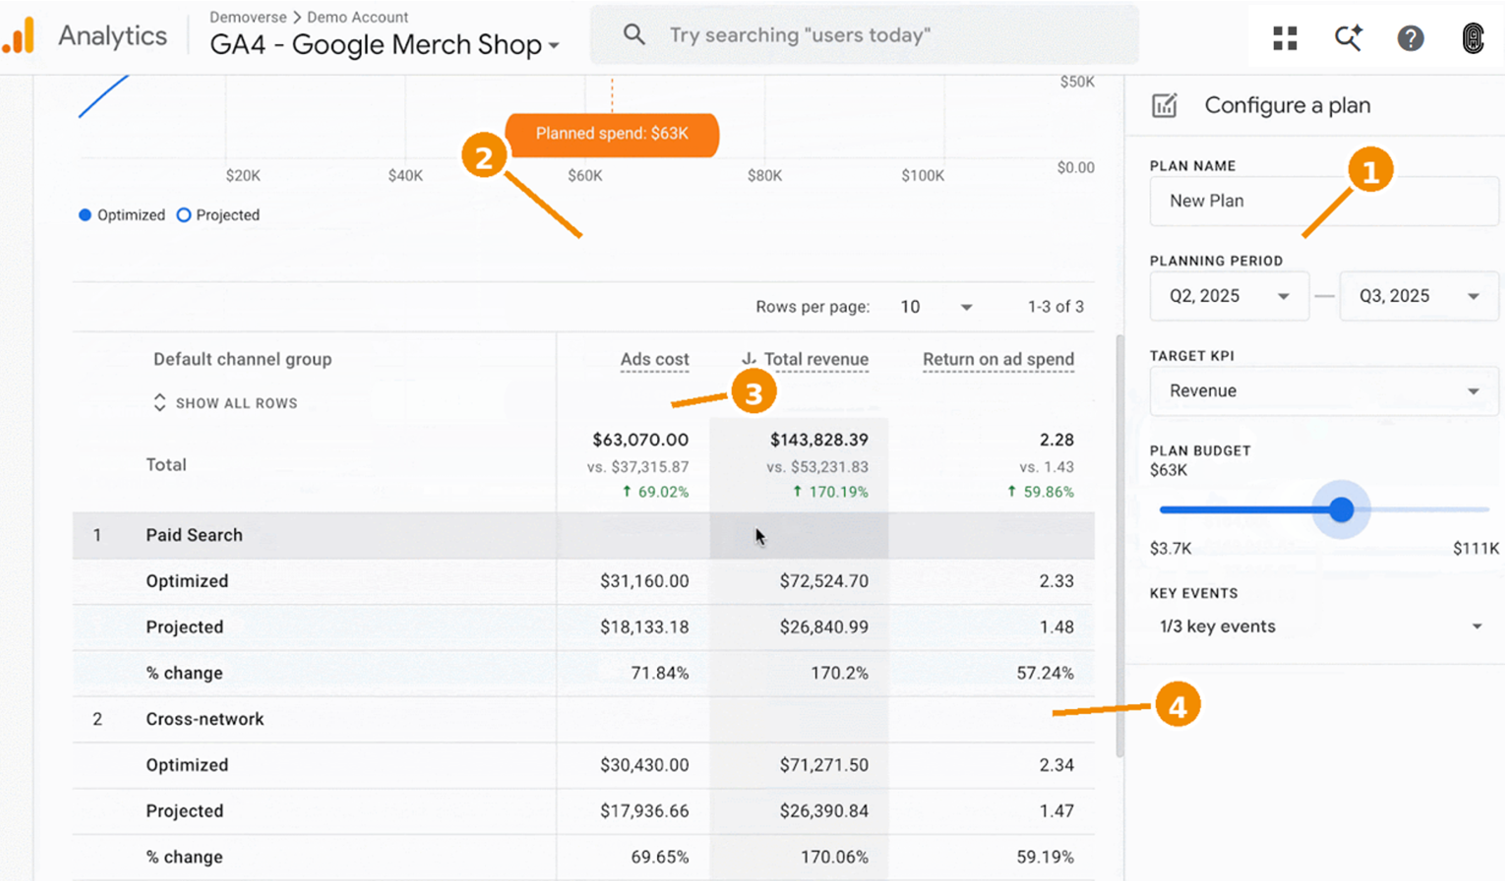
Recommended Steps:
1. Define planning period, target kpi, budget, eligible conversion.
2. Inspect diminishing returns, and relationship between spend and selected outcome.
3. Compare the current plan with the modeled optimized point.
4. Assess optimized vs. projected cost, revenue, and ROAS.
[Premium Subscribers: See my advice in TMAI #463 on why POAS is 10x more powerful than ROAS. Email me if you can’t find it.]
Make cool discoveries like shifting 20% of your budget barely moves projected revenue – welcome to the surprise that our channels are far more substitutable than Google, Meta, TikTok and others might imply. Such discoveries are immensely more valuable than recommended allocations, and they also change how you brief your Agency.
Higher Order Bit: I ran four allocations. Moving a fifth of the budget between them barely moves the revenue line. Which means we are optimizing a split that doesn’t matter, and the real lever is somewhere else entirely.
Cross-channel views are honest when you have cost data for all your spend. Google has made a ton of progress in making this easy. Here’s how to import campaign data from Meta ads, and TikTok ads. Without real cost data, my recommendations above will not be as life-altering as they should be.
Real life is in nuances… Cautions:
Remember: All models are wrong; some happen to be useful.
Any model trained on your own past will be wrong to a certain degree, because your present is not your past (or, I hope it is not!). Each time, present your analysis as a prediction, a projection, or a best estimate, but not a forecast.
Over time, you’ll be less wrong. And your predictions will gain more confidence.
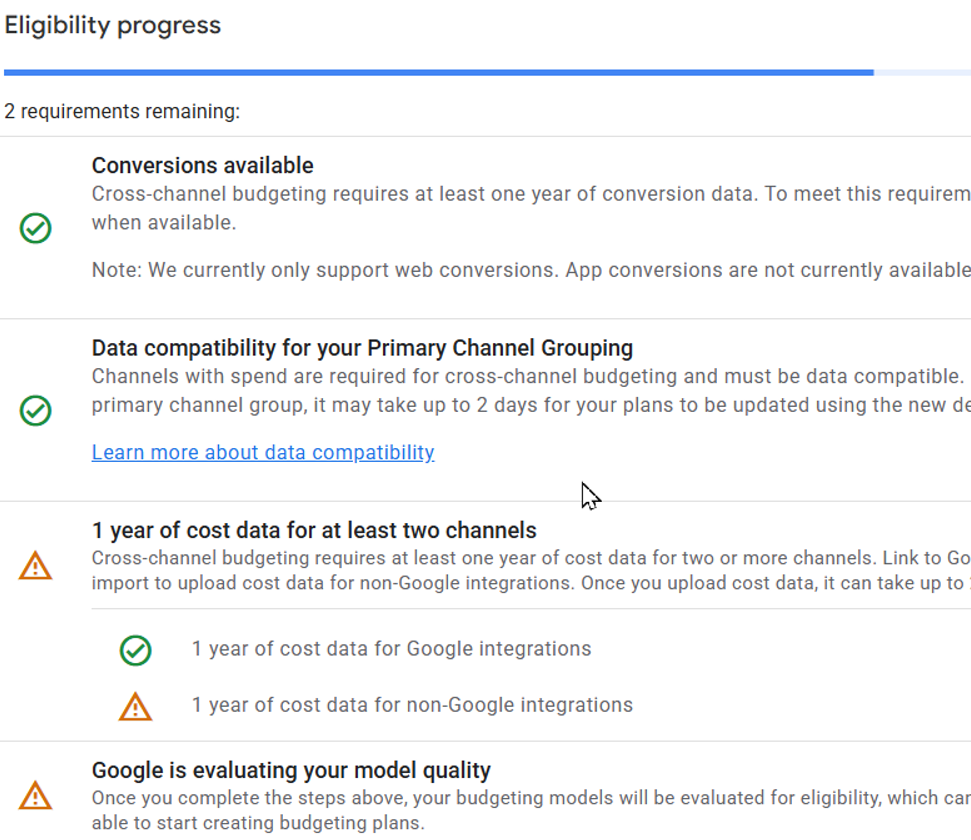
If you don’t see Advertising > Cross-Channel Budgeting, you will see what you need to be eligible:
4. “Conversational Analysis”: Ask Advisor.
Will you miss reports if they die?
I already don’t, because Claude can go do better analysis for me and find quality answers from Excel or Google Analytics in the time it takes me to navigate to the report I need (and then I need more time to figure out what the data is saying).
You can imagine my joy at seeing “Ask Advisor” – as uninspiring as that name is.
Now you can just ask a question, have the advisor do the complicated analysis, and get an answer that would otherwise take a bunch of effort:
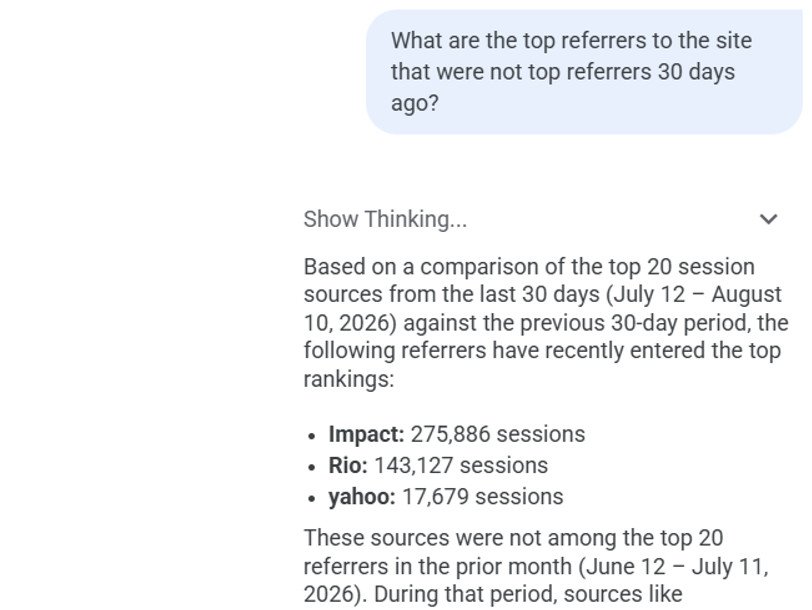
Location: A magnifying glass icon on the top right of your window.
Try your simple queries, try your complex queries.
Your day-to-day experience of GA will be much better if you just start with Advisor. Default to it, because see how hard this would be to answer via your normal reports vs. getting an answer in a few seconds:
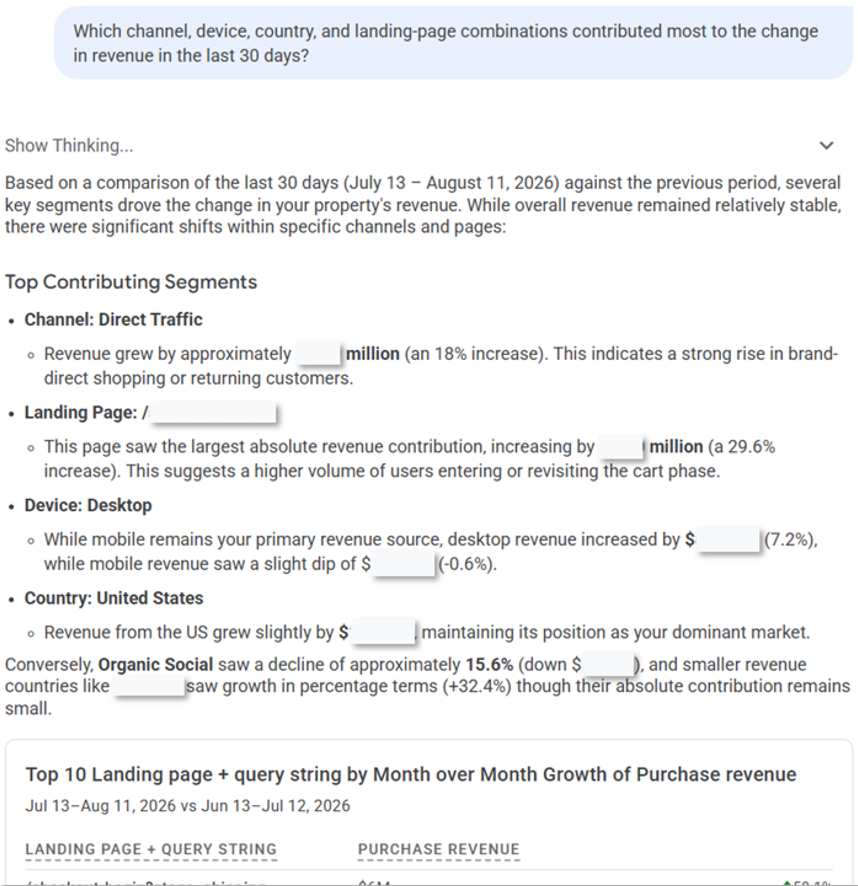
It is a struggle to get ESLs to use GA. But, tell them they have “AI” at their disposal and they might get excited to skip emailing you! They get answers quickly, and you get time back to focus on the hard questions. Bonus: The data pukes can slow down (or become self-serve!).
Have them try this query: What changed for my top two revenue-generating products over the last 30 days — traffic, channel mix, price, promo?
Show them a complex query you are using: Compare the last click credit attributed to top ten channels vs. the DDA credit attributed to each channel, and identify the top two that are being undervalued by last click, and by how much?
Ask Advisor is limited by what’s in GA. #doh
Even simple questions from your CMO require you to go outside of GA. Look at your Media Plan. Your Promotions calendar. Your internal offline customer sales data, and more.
Worry not. The team at Google has generously built out a first-party GA MCP server!
It connects your GA data to your fav LLM. Takes half an hour with a developer, I strongly recommend hooking up with ChatGPT or Claude. Now you have all the data in GA, and the ability to extend your analysis across a ton of new possibilities, as the MCP server is bounded by nothing.
1. Pull your top landing pages, have the model read each one, tag the topics, and tell you what your competitors cover that you don’t.
2. Pull channel performance, and cross it against your media plan and promo calendar in a single pass.
Outcome: Your Analysis Ninja powers expand well beyond just web analytics and go so much further in activating decisions. If you give your ESLs access they can answer the questions they actually have (which will naturally span the entire business vs. just the site).
Hook up your company’s approved LLM to the GA MCP, it’ll be a concrete sign of your expanded influence.
Real life is in nuances… Cautions:
If you ask causal questions, AI Advisor might start inventing. Be careful.
Prompts matter a lot. Please see my basket for 19 Analytics & Marketing prompts in TMAI #514 & #515 and use cases to improve yours for Advisor.
For more complex queries, examine the chain of thought reasoning. Understand the detours and biases.
Premium Subscriber Bonus.
For Premium Subscribers, I’ve created two helpful items – please email me for them.
GA Feature Activation Audit. It outlines 22 checks across the four main features (and two bonus ones below). What to check, where it lives, what good looks like. My Readiness Dashboard tells you which features you can use today and which you’re still earning.
AI True Traffic Total Kit. Recall the issues I’d outlined in item #1 that cause understating of your AE/AEO/LLM traffic and revenue. And, the lack of history prior to May 2026. Worry not. My toolkit outlines how to build a custom channel group via regex, the channel ordering rules, and includes a reconciliation worksheet that converts your AI floor into a defensible range (including “dark traffic”!). Replace my number with yours when you’ve collected evidence.
Bottom line.
We’ve used GA thus far primarily to explain what happened. In 2026, we have the capabilities to shift to driving what happens next – with concrete proposals.
The transformative shift to win before you spend… To Analysis Ninjas.
Carpe diem.
PS: Two additional notable features I’ve activated:
A. Source Group Consolidation.
It fixes the mess of situations like facebook, fb, meta-facebook, %instagram%, ig, etc. into a cohesive stream, say, Meta. Google’s own platforms have had this benefit in GA, now it can be applied to everyone. And, retroactively. End of regex hell.
After you activate, your first stop should be analyzing your cross-channel ROAS – be ready for surprises.
B. High-Value Purchasers with LTV Percentile.
Without the torture of BigQuery SQL, you can use a field called LTV Percentile to select top percentile of LTV users for your business. Your dearest, most-cherished, nicest to be, customers.
Why obsess with just “Purchasers”? They are not all worth the same. Find the 5% responsible for 40% of your profit! Then go back into Google Ads Audience Manager and have it find more of them. 😊