 Today's post comes from a source of deep pain. Analysis Ninjas are valued less than I would prefer for them to be.
The post is also sourced from a recent edition of my newsletter, The Marketing – Analytics Intersect. I send it once a week, and it contains my insights and recommendations on those two topics. Like this blog, the newsletter is geared towards being instantly actionable (rather than just theory-smart, which is pretty cool too). Do sign up if you want to deliver a small electric shock of simulation to your brain each week.
TMAI #41 covered a graph that resulted from a survey done by Econsultancy and Lynchpin. I received a ton of responses for it, and great discussion ensued. It prompted me to write this post, essentially an expanded version of TMAI #41. I've added new insights, recommendations, and two bonus lessons on how to do surveys better and a direct challenge to your company's current analytics strategy.
If your heart is weak, you can stop reading now. I promise, I won't mind one bit. I heart you. If you are open to being challenged… then here are the short-stories inside this post…
Three thoughts that explain the Econsultancy/Lynchpin graph.
Bonus #1: Lessons from Econsultancy/Lynchpin Survey Strategy.
Bonus #2: The Askers-Pukers Business Model.
Bottom-line.
Let's go and challenge our collective thinking!
The World Needs Reporting Squirrels. Wait. What!
Some of you know that I created the phrases Reporting Squirrels and Analysis Ninjas to emphasize the difference between those that puke data and those that puke insights with actions attached to them.
Here is my slide the first time I presented the concept in a keynote…

Cute, right? :)
While companies, medium and large, often need both roles, I’ve massively pushed for every company to want more Analysis Ninjas and for analysts to have careers where they can rapidly undertake metamorphosis from Reporting Squirrels to Analysis Ninjas (after all the difference in salary is tens of thousands of dollars).
If you are curious, here is a April 2011 post: The Difference Between Web Reporting And Web Analysis.
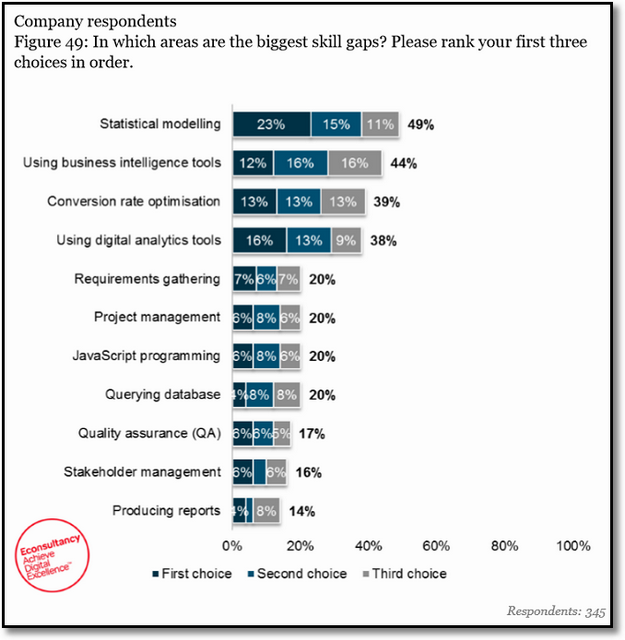
With that as context, you can imagine how heart-broken I was when Jane shared the following visual from a study done by Econsultancy and Lynchpin. It contains the answers to the question which analytics skills are most in demand…

Checkout the y-axis… what do you see as the common pattern across them all?
Just data puking.
One row after another of data puking skills.
Ranked.
Almost nothing that quite captures the value of Analysis Ninjas! N. O. T. H. I. N. G.
I did a random Google search and got this list of analytical skills:
+ Understanding relationships between numbers
+ Interpreting mathematical information
+ Visual perception of information
+ Ability to organize information
+ Pattern recognition and understanding trends
+ Argumentation and logical thinking
+ Ability to create insightful data visualizations
+ Hypothesis development and design of experimentation
+ Strategic thinking skills
And, that is just a random list!
None of these are in demand?
Look at the list in the graph, what kind of purple squirrel with ant legs and an elephant's nose that nobody needs is Lynchpin describing?
This did not happen at Econsultancy, but the data did cause introspection at my end.
And, my first question was the one that is also top of mind of all readers of Occam's Razor… Is the world so dark that the only "analytical" skills that are valued are directly tied to data puking and you should immediately shut down your Analysis Ninja efforts?
Let me share three thoughts for your consideration, then some guidance on how to do surveys right, and end with a call to arms for all of you and the "data people" you choose to work with.
Three thoughts that explain the Econsultancy/Lynchpin graph.
1. The survey design is at fault.
The otherwise well-respected Econsultancy and Lynchpin dropped the ball massively in creating the list of answers for the respondents to choose from.
I have to admit, I believe this is a major flaw (and not just for this question in the entire report). What is disappointing is that they have done this for nine years in a row!
It poses these questions…
How is it that in nine years no one at these organizations realized they were simply asking people to rank data puking answers? Did the survey list the skills Econsultancy and Lynchpin hire for and value in their own analysts?
The graph illustrates data for three years… Was the fact that almost nothing changed in three years in terms of priority not trigger a rethink of the options provided for this question? Anyone reading the report at the two companies creating it should have thrown a red flag up and said hey guys, the respondents keep rating the answers the same, maybe we are not asking the right question or providing the best choices for our respondents to pick.
More on how to avoid this flaw in your surveys, of any kind, below.
2. The survey is targeted to the wrong folks.
They might be the wrong folks to accurately judge what analytical skills and how to appreciate the value of each skill as they rank them. That could explain the results (not the answer choices though).
Econsultancy/Lynchpin provides this description in the report: "There were 960 respondents to our research request, which took the form of a global online survey fielded in May and June 2016. Respondents included both in-house digital professionals and analysts (56%) and supply-side respondents, including agencies, consultants and vendors (44%)."
The survey was 76% from the UK and EU. Respondents were solicited from each company's database as well as Social Media.
Here is the distribution provided in the report:
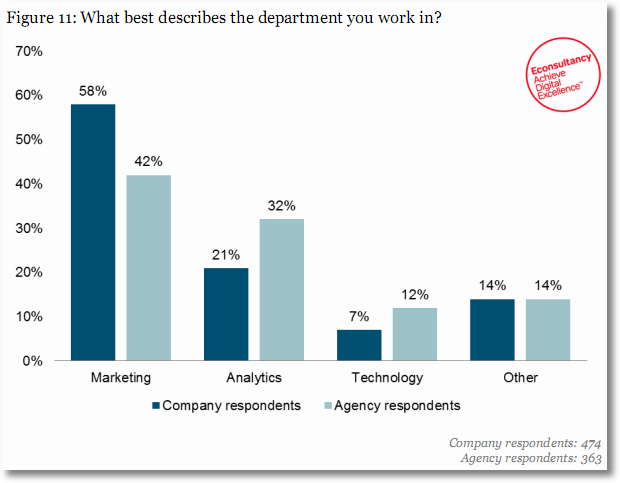
On paper it looks like the departments are to be what you would expect. It is difficult to ascribe any blame to the folks who got the survey. There is a chance that there is a UK and EU nuance here, but I don't think so.
3. It is our fault.
My first instinct in these cases is to look into the mirror.
Perhaps we have not succeeded as much as we should when it comes to show casing the value of true data analysis. Perhaps all the people involved in all digital analytics jobs/initiatives, inside and outside companies, are primarily data pukers, and none of them have skills to teach companies that there is such a thing as data analysis that is better.
Then, you and I, and especially our friends in UK and EU, need to work harder to prove to companies that CDPs (customized data pukes, my name for reporting) do not add much value, the rain of data does not drive much action. You and I need to truly move to the IABI model were we send very little data, and what little we send out is sent with copious amounts of Insights from the data, what Actions leaders need to take, and the computation of the Business Impact.
The more we deliver IABI, by using our copious analytical skills, the more the leaders will start to recognize what real analytical skills are and be able to separate between Reporting Squirrels and Analysis Ninjas.
Bottom-line… I would like to blame the competency at Econsultancy and Lynchpin, especially because I believe that truly, but I must take some responsibility on behalf of the Analysis Ninjas of the world. Perhaps we suck more than we would like to admit. I mean that sincerely.
Bonus #1: Lessons from Econsultancy/Lynchpin Survey Strategy.
There are a small clump of lessons from my practice in collecting qualitative feedback that came to fore in thinking about this particular survey. Let me share those with you, they cover challenges that surely the E+L team faced as they put this initiative together.
If your survey has questions that cease to be relevant, should you ask them again for the sale of consistency as you have done this survey for nine years?
There is a huge amount of pressure for repeated surveys to keep the questions the same because Survey Data Providers love to show time trends – month over month, year over year. It might seem silly that you would keep asking a question when you know it is not relevant, but there is pressure.
This is even worse when it comes to answer choices. Survey Creators love having stability and being able to show how things have changed, and they keep irrelevant/awful/dead answers around.
If you are in this position… You will be brave, you will be a warrior, you will be the lone against-the-tide-swimmer, and you will slay non-value-added stuff ruthlessly. You will burn for from the ashes shall rise glory.
If you are the Big Boss of such an initiative, here is a simple incentive to create, especially for digital-anything surveys: Give your team a standard goal that 30% of the survey questions for any survey repeated each year have to be eliminated and 10% new ones added.
Your permission will 1. force your employees to think hard about what to keep and what to kill (imagine that, thinking!) 2. create a great and fun culture in your analytical (or reporting :( ) team and 3. push them to know of the latest and greatest and include that in the survey.
If I feel I have a collection of terrible choices, do you have a strategy for how I can identify that?
This does not work for all questions of course, but here is one of my favourite choice in cases where the questions relate to organizations, people skills, and other such elements.
Take this as an example…
How do you know that this is a profoundly sub-optimal collection of choices to provide?
For anyone with even the remotest amount of relevant experience, subject matter expertise, it is easy to see these are crazy choices – essentially implying purple squirrels exist. But, how would you know?
Simple.
Start writing down how many different roles are represented in the list.
That is just what I did…

It turns out there are at least five roles in a normal company that would possess these skills.
So. Is this a good collection of skills to list? Without that relevant information? If you still go ahead and ask this question, what are you patterning your audience to look for/understand?
Oh, and I am still not over that in looking for what analysis skills are missing in the company, no actual analytical skills are listed above! Ok, maybe statistical modeling smells like an analytical skill. But, that's as close as it gets.
I share this simple strategy, identifying the number of different roles this represents, to help you illuminate you might have a sub-optimal collection of choices.
There are many other strategies like this one for other question. Look for them!
If your survey respondents are not the ideal audience for a question, what's your job when crafting the survey?
J. K. I.
Just kill it.
If you don't want to kill it… Personally interview a random sample of 50 people personally (for a 1,000 people survey). Take 10 mins each. Ask primitive basic questions about their job, their actual real work (not job title), and their approximate knowledge. If these 50 pass the sniff test, send the survey. Else, know that your survey stinks. JKI.
I know that I am putting an onerous burden on the survey company, taking to 50 people even for 10 mins comes at a cost. It does. I am empathetic to it. Consider it the cost of not putting smelly stuff out into the world.
If your survey respondents won't be able to answer a question perfectly, what is a great strategy for crafting questions?
Oh, oh, oh, I love this problem.
It happens all the time. You as the survey creator don't know what you are taking about, the audience does not quite know what they are talking about, but there is something you both want to know/say.
Here's the solution: Don't do drop down answers or radio button answers!
The first couple times you do this, ask open ended questions. What analytical skills do you think you need in your company? Let them type out in their own words what they want.
Then find a relatively smart person with subject matter expertise, give them a good salary and a case of Red Bull, and ask them to categorize.
It will be eye opening.
The results will improve your understanding and now you'll have a stronger assessment of what you are playing with, and the audience will not feel boxed in by your choices, instead tell you how they see the answers. (Maybe, just maybe be, they'll give you my list of analytical skills above!)
Then run the survey for a couple years with the choices from above. In year four, go back to the open text strategy. Get new ideas. Get smarter. Rinse. Repeat.
I would like to think I know all the answers in the world. Hubris. I use the strategy above to become knowledgeable about the facts on the ground and then use those facts (on occasion complemented by one or two of my choices) to run the survey. This rule is great for all kinds of surveys, always start with open-text. It is harder. But that is what being a brave warrior of knowledge is all about!
If your survey results cause your senior executives, or random folks on the web, to question them, what is the best response?
The instinct to close in an be defensive, to even counter-attack, is strong.
As I'm sure your mom's taught you: Resist. Truly listen. Understand the higher order bit. Evolve. Then let your smarter walk do the talking.
Simple. Awfully hard to do. Still. Simple.
Bonus #2: The Askers-Pukers Business Model.
The biggest thing a report like Econsultancy/Lynchpin's suffers from is that this group of individuals, perhaps even both these companies, see their role in this initiative as Askers-Pukers.
It is defined as: Let us go ask a 960 people we can find amongst our customers and on social media a series of questions, convert that into tables and graphs, and sell it to the world.
Ask questions. Puke data. That is all there is in the report. Download the sample report if you don't have a paid Econsultancy subscription. If you don't want to use your email address, use this wonderful service: www.throwawaymail.com
Even if you set aside the surveying methodology, the questions framing, the answer choices and all else, there is negative value from anything you get from Askers-Pukers, because the totality of the interpretation of the data is writing in text what the graphs/tables already show or extremely generic text.
Negative value also because you are giving money for the report that is value-deficient, and you are investing time in reading it to try and figure out something valuable . You lose twice.
Instead one would hope that Econsultancy, Lynchpin, the team you interact with from Google, your internal analytics team, any human you interact who has data sees their role as IABI providers ( Insights – Actions – Business Impact).
This is the process IABI providers follow: Ask questions. Analyze it for why the trends in the data exist (Insights). Identify what a company can/should do based on the why (Actions). Then, have the courage, and the analytical chops, to predict how much the impact will be on the company's business if they do what was recommended.
Insights. Actions. Business Impact.
Perhaps the fatal flaw in my analysis above, my hope above, is that I expected Econsultancy and Lynchpin to be really good at business strategy, industry knowledge, on the ground understanding of patterns with their massive collection of clients. Hence, knowing what actually works. I expected them to be Analysts. Instead, they perhaps limit their skills inside the respective company to be Askers-Pukers.
Both companies are doing extremely well financially, hence I do appreciate that Askers-Pukers model does work.
But for you, and for me, and for anyone else you are paying a single cent for when it comes to data – either data reported from a survey, data reported from your digital analytics tool, data reported from other companies you work with like Facebook or Google or GE – demand IABI. Why. What. How Much. If they don't have that, you are talking to the wrong people. Press the escape button, don't press the submit order button.
[Isn't it ironic. Econsultancy and Lynchpin did exactly what their survey has shown for nine years is not working for companies in the UK: Reporting. The outcome for both of them is exactly the same as the outcome for the companies: Nothing valuable. This is explicitly demonstrated by their full report.]
I hope you see that this one survey is not the point. E + L are not the point. What their work in this specific example (and you should check other examples if you pay either company money) illuminates is a common problem that is stifling our efforts in the analytics business .
This applies to E+L but it applies even more to your internal analytics team, it applies extremely to the consultants you hire, it applies to anyone you are giving a single cent to when it comes to data.
Don't hire Askers-Pukers. Don't repeat things for years without constantly stress-testing for reality. Don't make compromises when you do surveys or mine Adobe for data. Don't create pretty charts without seeing, really looking with your eyes, what is on the chart and thinking about what it really represents.
Applied to your own job inside any company, using Google Analytics or Adobe or iPerceptions or Compete or any other tool… don't be an Asker-Puker yourself. Be an IABI provider. That is where the money is. That is where the love is. That is where the glory is.
Carpe Diem!
As always, it is your turn now.
Is your company hiring Reporting Squirrels or Analysis Ninjas? Why? Is the work you are doing at your company/agency/consulting entity/survey data provider, truly Analysis Ninja work? If not, why is it that it remains an Asker-Puker role? Are there skills you've developed in your career to shift to the person whose business is why, what, how much ? Lastly, when you do surveys, of the type above or others, are there favourite strategies you deploy to get a stronger signal rather than just strong noise?
Please share your life lessons from the front lines, critique, praise, fun-facts and valuable guidance for me and other readers via comments.
Thank you. Merci. Arigato.
PS: I hope this post illuminates the valuable content The Marketing – Analytics Intersect shares each week, sign up here .


 Via
Via 


Hi Avinash,
Just this second your newsletter ended up in my inbox and I had to comment on it.
Askers-pukers model is really one of the greatest things I've read recently. I was just in discussion how I hate the skyscraper content method that led to all those "10 things you need to..", "15 things you need to..", "20 things…." you know.. and then this came in. Because I hate these "Empirically looking nonsense reports" just as much. The best thing is the hidden irony between dealing with Analytic Skills whilst showing not even a hint of it themselves.
Cheers,
Pascal
Asker puked model is interesting.. first time ever heard of it.
Kidding.
While the name is new, we are surrounded by Analysts and Agencies who practice this model. As they realize that revenue is not in this model for them or their clients hopefully they will take your advice to morph into IABI providers.
Avinash – I read this, then read it again. I didn't know whether to laugh or cry.
Thank you for not only pointing out some of the weaknesses but also suggesting some positive things to improve matters. These are the real learnings for me. Keep em coming.
We have to remember that every generation is being exposed to exponentially more data and the tools to assist in understanding lag. More important we don't teach this kind of critical thinking to nearly enough people.
We are still very early in a huge journey and much like DTP was in the 1980s you can use good tools and produce bad work. It takes time to develop the appreciation of how to make a difference with all this new data.
Peter: I concur with you about the speed and quantity of change that is happening. It is a bit crazy. I hope this is taken by vendors, consultants, and internal Analysis Ninjas as a call to arms to invest regularly in self-development.
It is so very easy in this industry to become stale. It use to take 20 years, it takes less than 2 now.
Avinash.
Thanks Avinash sir for sharing this awesome artcle.
Hi Avinash,
I really liked bullet #3: "It is our fault."
This is 100% true. But I was wondering: is it possible that the very structure of businesses cause the phenomenon of data puking?
I mean, assuming that most people are actively seeking promotions, the only way for them to prove their points and to elevate in the hierarchy is to generate reports validating their hypotheses and proving that they were right in the first place. I would suggest that such a bias does not lead to greater insights, but to data pukes, as you described so well.
Benoit: Yes, the way modern orgs function they do incentivize lots of data puking. There is a mistaken belief that just access to data is enough to make smarter decisions.
No, what you are describing as requirement for promotions is analysis, and analysis is good. Sadly, though most of the time people just get loads of data, due to lack of skills or training they are unable to convert that data into analysis which results in fewer promotions.
We can change this tough.
Avinash.
I continue to be amazed at your ability to identify structural gaps in thinking from just one slide.
One element that might be unique to you is that you get outraged when you see bad things, while most people rarely are passionate enough to give it a second glance. That is a lesson I'll take with me from your post.
Continue to point out these issues and push the industry forward.
You wrote a lot to make a simple point. The survey was extremely poorly done with little thought to the audience and topic being measured. Tracking surveys makes sense when the kpi's being measured are in fact consistent (e.g., brand awareness). The Researchers failed to recognize the skills of an 'analyst' are not consistent over time or universal across industries and geography. But the point that people need to think crtically about what analysts do or should do within their organization is well taken. On survey strategies, there have been many a good book written on the subject of (marketing) research surveys that hardly need a rehash here.
Avinash, thanks for the article. I think business is evolving. I think organizations are at the beginning of the journey on how to use the data they emit. I appreciate the inspiration.
Hey Avinash,
Thanks for putting your thoughts and feedback into the public domain – I could definitely feel my ears privately burning on the edge of the Marketing – Analytics Intersect last week!
We do put our Lynchpin name to this survey – by way of sponsorship rather than overall authorship I should emphasise – which makes us absolutely open to challenge by association.
For the avoidance of doubt (and rumour of unloved/unwanted weird squirrel/elephant/ant hybrids occupying Lynchpin towers) I definitely agree that companies should seek out analysts with fundamental traits around numeracy, pattern recognition, communication, commercial awareness, hypothesis development, strategic thinking and so on.
In blunt terms, I think the idea of your world view being substantially different to that presented in the survey report and/or the industry reality is perhaps overstated.
You cite IABA as the model to aspire to ("Be an IABI provider. That is where the money is. That is where the love is. That is where the glory is.").
I'm certainly not disagreeing with that aspiration, but I'd simply call IABA as you describe it "good reporting". OK, really good reporting, fantastically tailored to the audience in terms of granularity and context and so on. But still, ultimately, the end product is: a report.
So I can agree that bad reports = data puking and good reports = insight puking. Maybe less puking would be good overall. But I'm not sure the reporting squirrel ("loser"?)/analytics ninja ("winner"?) differentiation is always a helpful reference point from an organisational perspective or a career development plan.
We had an interesting panel discussion when the survey was first published (with people that run internal analytics teams for large companies on the panel, not a bunch of consultants), and a lot of the discussion focused around how information is communicated around the organisation and carefully managing the interactions with stakeholders involved to drive success.
I appreciate stakeholder management is a fairly corporate/bullshit term, but it's far from "data puking" and increasingly what I hear VP's (or UK equivalent) seeking in their analytics teams.
I like your "sniff test" analogy. I promise you those phrases in the offensive graphs would not be in the survey if we weren't hearing them consistently from people that hold budgets describing what they think they need from their analytics functions.
You rightly classify them into multiple roles. We were deliberately looking to show the breadth of expectation set upon "analytics teams" and "analyst roles" by businesses (please fix the TMS, please present to the board, please predict our sales for next year, please tell us something useful/interesting about our customers, please help us understand what our objectives are) rather than suggesting a one person frankenstein monster exists.
That said, 3 years ago statistical modelling was the least recognised skill-gap. Now it is the most recognised.
I think that's perhaps still relevant as a trend for budding squirrels on this exciting intersection to understand.
Look forward to next year's debate!
Cheers,
Andrew
Andrew Hood
Managing Director
Lynchpin
Andrew: Thank you for sharing your perspective.
There is a lot more in your comment and you have absolutely carried me with you with other things you mention. I am deeply grateful for the food for thought you've provided.
I'll humbly push back on the idea that IABI is reporting. It is not.
Reporting it producing a report or a chart – a clever one, a pretty one, a necessary one (in most modern corporations, there is no escape from reporting).
My definition of insights, and the thing that my students are learning at Market Motive and the thing that my large team at my employer uses, is why the thing that you see in the chart/table happened. A mix of deep dive analysis and business analysis.
My definition of actions are the things that a client should do. A mix of business strategy and competitive analysis. The output is words in English (or Urdu or Hebrew or Mandarin).
My definition of business impact is how much a brand or performance KPI will move if aforementioned action is accomplished. The output is one number, mentioned next to each line of English/Urdu.
75% of the above is not reporting, neither will it come from your Google Analytics account, your Micro-Strategy BI tool account etc. etc. It comes from a human's ability to dig and understand business strategy and relationships with Sr. Leaders.
I think of that as output of analysis: IABI.
No reporting I have ever seen has ever had the three elements above. At it's very best, as you also saw in the Econsultancy report, "really good reporting" repeats in text what the report (CDP) shows.
I hope I can carry you with me in the difference between reporting and analysis.
Thank you again.
Avinash.
Hi Avinash, I am really happy that you wrote a post about this issue. You are a true crusader. we owe you a lot.
One confession to make –
I get all your new posts through email. Basically, I don't read the whole post at that time. I come back later when I have some quite time. For my visit to not considered as bounced, I just click on any link before leaving the site :). I know 1 visit with bounce isn't going to change anything but I just don't want to disappoint you. I really feel bad and week for doing this. But I also think that It is my love and respect to you and all the hard work you put into Occam's Razor that I can't possibly disappoint you. And one more thing, waiting very patiently for your next book "Web analytics 3.0".
Hope you have a great day and an awesome life.
Bhola: You are kind, but you should not worry about Bounce Rate for this blog. I use the strategy I recommend everyone follow… I only measure Bounce Rate for New Visitors. For Returning, I know that most will read the latest post, and that is ok!
I do love it when they share their experience via comments, it helps everyone. So, thank you.
Avinash.
In fact you should not be worried about bounce rate for new visitors too.
Your articles are so thought-provoking, and also lengthy, that often users would take time to read and digest it. Maybe you should just look at conversion of new visitors into returning, and ensure that the "tl; dr" audience is less.
Good stuff. I always enjoy reading your articles.
This reflects what I see in the marketplace. Businesses want outcomes but hire staff based on outputs. Econsultancy's list looks like an employment posting, just a long list of outputs.
As long as the squirrels are managed by people that know the outcomes they're after, is there a problem?
Greg: This is a real problem, as in it is real and it is a problem!
Part of the responsibility falls on the current leadership at companies (in pretty much any country) that do not truly value digital, and in turn have lax management of it relying on their gut or sub-optimal metrics. This sounds lame, it is 2016 after all. But, it is sadly true. Now you know where those job descriptions come from.
Part of the responsibility, as I mentioned in #3 in this post, falls on us, the data people. We spend so much time gathering data, conflate sexier javascript tags with accomplishment, and only have time left over to data puke. We have to change this, else the job descriptions won't change.
Avinash.
Enough said.
You hit the nail on the head in your reply to Greg. Ninja's are respected and are expected to perform in the face of danger. Squirrel just gather nuts and run.
We found that when trying to identify issues or areas of concerns, we wrote queries to identify the Top 25 Negative Noun Tokens in Sentences and include the related sentences after Natural Language Processing.
We then grouped those sentences for tagging in an interactive tree (tree of sentences). We were able to identify the top issues affecting consumers, very quickly; because of the refined sample size (Top 25 Tokens).
We would repeat this effort with each week of new data…slowly becoming the knowledge experts in the source domain.
As the unique issues started to dry up we instituted a dynamic filtering system where every keyword in a sentence became a filter. We could shuffle the results with each click, spinning the results.
We also implemented the ability to combine those keywords and flip them for even more complex dynamic filters. And then we also started an automatic favourite keyword identification system so that on subsequent weeks of results, I knew which keywords/favs were able to pull back the targeted results we were after.
So for those looking to find the top negative issues, this may be a plan of attack in the identification of issues, something you could include in your own system or check out text-analyzer.com to see this in action. Hope this helps someone when the uniqueness in the results seems to dry up.
Very thought-provoking! The reporting vs. analysis issue clearly stands out as THE challenge at the company I work at, in terms of data use. The current trends of "big data" and "lean analytics" make this old issue very poignant.
I wonder about your push for metamorphosing squirrels into ninjas. Is that a natural progression? Is it the only progression? The best progression?
You note the importance of posing the right questions the right way with the right people in survey development. Asking open-ended questions to develop the right survey response selections is just one example that highlights the importance of developing good tactical approaches when developing data.
You nicely tie in the importance of strategic analysis — the 'why' question in IABI, which provides fodder for hypothesis development in Lean Analytics. This is a call for thinking about analytics as an expression of human behavior, motivation, and thinking.
Changing human behavior is the implicit outcome of all the data analysis, and I like how you draw these connections.
I'm a user experience researcher with a background in experimental psychology. I can't help but wonder if a reverse transition, from understanding human behavior into data analytics, could also work, and perhaps provide an even easier metamorphosis.
If we place Analysis Ninja at the top of the value pyramid, then it will require a person who has one foot firmly planted in both data and human behavior.
Michael: There are a lot of wonderful elements to your comment, thank you for sharing your thoughts.
Let me touch on a couple.
There is a difference between small and big companies.
Small companies need someone as close to an Analysis Ninja as possible, and it would be great if the person can also operate machinery and do marketing. Small companies can't afford a lot. :) Reporting Squirrels at small companies are actively harmful, not only can they drive little change, an investment in them might have an expensive opportunity cost.
In big companies, you will, for the next five years or so, need Reporting Squirrels and Analysis Ninjas. Part of the need for Reporting Squirrels is being driven by the fact that big companies simply cannot do without the silly charade of data being puked left, right and center. Part of it is that there are some orgs where super-tactical decisions can be made by people in the division, and they just need CDPs more efficiently delivered. More companies are realizing they need Analysis Ninajs because efficient, real-time CDPs are simply not working.
From Reporting Squirrel to an Analysis Ninja is not a natural progression. It happens 20% of the time, but analytical skills are so different than what reporting jobs mandate.
It is important to note that Reporting Squirrel is a well paid job, and for many they like the comfort of what the job demands are. Hence, it is a fabulous job if it fits your personality profile, skills and professional goals.
To your note on users… I believe, most especially for digital, we have access to so much quant and qual human behavior data, skills in User Experience Research (UCD, HCI etc.) would be immensely valuable to an Analysis Ninja.
-Avinash.
Amazing insights.
A lot of market-researchers do not have much appreciation for customer behavior methods, and they end up becoming askers-pukers.
A smart marketer at times may not even need too much data, but just some intelligent customer behavior analysis methods and hypotheses to come up insights that will win the game for her.
Very insightful information…
Makes me think and wonder about some of my decision making on marketing that I've done.
Thank you for helping me understand clearly how to interpret survey results. It painful to see how silly some of these mistakes are.
Avinash,
I love you. There, I finally said it.
Unfortunately, many organizations that rely on and even sell information technology for a living want reporting squirrels, because they are sending the KPIs they want from the top down. For all the lip-service to insight, some of the biggest orgs in the world don't have a single clue.
They not only don't want your insight, they don't value it at all. They look for the data points that match their strategy. I wish it wasn't true–but our thinking does not penetrate the CSuite. This is why they want reports.
The day to day reality of analysts is being asked to get a specific number, not explain it. And then put it in a pretty report that a CXO can look at in the 1 minute of the day he devotes to checking on the health of his company.
Avinash Sir, thanks for the awesome article.
I liked "It is Our Fault" point very much.
I always enjoy reading your articles.
Thanks.
Thanks for that great article.
I really like the amount of insights you put into your articles and that you are not afraid of them getting longer than the average blog post. I was really amazed how much insights one can gain be just following a few simple steps and guidelines.
Thank you for sharing your knowledge in such detail here Avinash.
I learned a collection of new things that were not on my radar as an Analyst. We have invested a lot in qualitative analysis and plan to update per your guidance.
Great details as usual!
I appreciate your perspective on this topic. I find that a lot of "data" is floating around is quite suspect, yet little pressure is put on these sources to clean their acts up. Let's hope that we see change in the approach econsultancy takes.
I continue to be amazed at your ability to identify structural gaps in thinking from just one slide.