 Second in a series that aims to share some guidance on how to move from the world of Web Analytics to the world of Web Insights.
By now it is fairly well established that absolute numbers (KPI’s) that represent one data point are fairly useless. Example: what was the conversion number in May. Just by itself it is not useful.
A while back we all moved to measuring trends which gave a bit more context to our metrics. Example: what is the trend for my conversion rate from January to May (or even better from May last year to May this year). Gives nice context on if we are up or down over a time period and over same time last year.
New Nirvana Rule: Never report a metric (even God’s favorite KPI) without segmenting it to give deep insights into what that metric is really hiding behind it.
The power of segmenting a metric is that you peek behind the curtain and find out more about the metric. These are the benefits that you will gain:
- It is impossible to segment any metric without putting in the effort to understand what we are reporting and the business value that the metric represents. This is hard work but what does not kill you makes you stronger. :~)
- Segmenting allows you to quickly hone in on areas of deeper dive from which will emerge key insights that will drive real and meaningful action.
- Our senior executives and decision makers don’t understand all the complexity and magic that is a web experience, showing them segmented trends is a extremely effective communication tool (and the best part is you barely have to talk, the picture will tell the story).
- You will earn a big fat bonus and promotion.
Leaving you now would be lame, here is my attempt at providing examples that illustrate this recommendation.
We have established that this is not very useful:
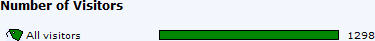
I have recently come to believe that if a visitor does not stay on the site for atleast five seconds then that is an unqualified visitor (or that we never had a chance with them). Because even the most compelling websites need atleast five seconds to sell you on anything (not just products but even ideas). So application of a simple segmentation to me on this website is how many people are in the game.

This simple segmentation tells me that just 48% of all the traffic stayed for more than five seconds, I never had a chance with the others. Let’s say your traffic this month was up, instead of getting credit you’ll be prompted to dig deeper into what happened, what were the reasons for 52% of the traffic leaving so quickly. Were we running wrong campaigns, are our meta tags wrong? It might prompt questions about what the number was for prior months.
There is a nice flip side though, if only 48% of the traffic stayed for more than 5 seconds look at what it can do to your conversion rate (it goes up, bonus for you baby!).
Another way I could segment this traffic is by the hottest thing on earth: Search. I got great traffic but how many did I get from Search, and I wonder how may from Google.

Again you have a nice little context for your total traffic that you would not get by just showing total traffic by itself. You can now say we are only getting 18% of our traffic from search engines (is that good or bad? you decide) and 85% from google. There is a recommendation sitting in there about our search strategy and perhaps diversifying to other search engines (per the latest numbers google has 47.8% of overall search traffic). Alternatively your CEO could say: My influence circle is wrong, if search is not “hot” for us then where are people coming from?
But you can go further and stitch the story together with the first example…..

This might be a home run, one picture shows a great story all together. We are getting a good amount of traffic from google but of that only 34% is staying for more than 5 seconds. Since such a unusually high amount of traffic is from google might be SEM/PPC in which case we are much worse off because we spending money and people are not staying on our site.
Here is a example of how you can analyze segmented data over time and make the story even more powerful….
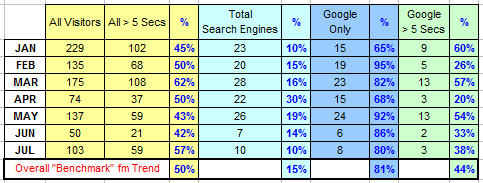
It is not pretty but I am sure even without any context you can look at these numbers and draw out so many nice insights that could lead to actions.
The “Overall “Benchmark” fm Trend” is simple average of this year’s performance and that gives you a cool way to see how the latest month is doing. Of course you can make it even better if you have pre-set goals.
Hopefully you see the power of segmentation demonstrated even by such a simple example. For your website and business maybe it is not time on site that is important, maybe it is page views, maybe it is conversion rate, maybe it is number of leads, maybe it is DM Campaigns, maybe you only rely on PPC/SEM.
Understand what your business is, what are areas of strategic focus and then segment away.
Please take a vow that today is the last time you have sent a excel dump of Top Pages on Site report to the entire company, change that to Top Pages Viewed by All Visitors by Search Traffic and by Top Affiliate Partners (or whatever).
There is no KPI so insightful all by itself, even in a trend or against a forecast, that it can’t be made more impactful by applying segmentation.
Agree? Disagree? Have examples? Please share your feedback via comments.


 Via
Via 


Hi Avinash,
I couldn't agree more. All data is relevant. If you don't know what part is relevant and to what degree it is relevant, and you don't know what it's relevant to, then you don't know your data, you don't know your flow, and you probably don't know your visitor's goal.
That said, I think we are still at the starting gate of the intelligence age, and it will be some time before we get things in a format that easily facilitates the right segmentation questions.
Which is another reason why I agree with the 10/90 rule; systems and tool don't ask the right questions, people do.
-bruce
Bruce: Thanks for taking the time to comment on the post, I appreciate that very much.
I agree with you that we are at the starting gate. But it is amazing how many of us (self included) are so far from the gate entry point. It is almost as if people are afraid of the word segmentation because it seems hard.
My hope with the post was to illustrate that even with the simplest run of the mill segmentation you can glean great insights.
I agree as well, segmenting everything is the only way to truly determine user behavior and online success. When metrics are left generalized it leads to poor business decisions.
Avinash Wrote: My hope with the post was to illustrate that even with the simplest run of the mill segmentation you can glean great insights.
That you did Avinash. Well done! As I have come to expect in the short time your blog has existed, another thought-provoking blog entry.
It was an interesting piece of analysis. You are right. The most important factor that one has to take into consideration is about stickiness. But i am not sure whether most people report the way you have suggested, though i use this way of metric analysing for my personal sites. Primarily to understand whether my posts have captured the attention of users. We can also use the other metric like "404", which can also help to understand how many visitors were not able to see the pages. This would give a fair idea of how many visitors we are loosing every month.
The behavioral segmentation potential of the web channel is enormous. A thought provoking piece of analysis !
[…]
Nesta fase, metade do caminho está completa. Porém, você precisa ficar de olho em algumas métricas:
* Visitantes únicos da busca orgânica: o guru Avinash Kaushik vive dizendo que devemos segmentar tudo. Concordo. Temos que tratar a audiência da busca orgânica de forma separada do resto da audiência de um site, já que cada fonte de tráfego pode revelar um padrão de comportamento diferente. Neste caso, você quer acompanhar a evolução da cobertura das buscas na audiência do seu site.
[…]
Great informational post.
How can I separate the Visitors Less than 5 seconds with the Total Visitors in Google Analytics.
Thanks in advance.
– – –
NOTE : Imran it is a bit complex to do this in GA. This comment from Justin Cutroni might be helpful:
https://www.kaushik.net/avinash/2008/01/standard-metrics-revisited-time-on-page-and-time-on-site.html#comment-405360
-Avinash.
Hi Avinash,
I am just reading your all posts from first to last (May 2006 – till today 2008). Just now I am in the first month of your blog post.
Before knowing this blog I bought your Web Analytics An Hour A Day book from one of the book house.I liked the segmentation and importance of Bounce Rate tips from the books.Know was including "Bounce Rate" metrics in the reporting.
First time I included that and I got insights which were really useful for optimizing PPC campaigns.
I liked the segmenting the data by using Click Tracks. I had segmented my data as per time on site High (more than 150secs.),Medium (45 – 150 secs) and Low (less than 45 secs).
By using these segmentation I measured the number of qualified leads.
I found that PPC takes more Medium time and Organic & Referrers consumes more than 150 secs.
Also according to these information, deeper segmentation done and it has been helped to us for doing Geo and Source targeting. :)
I hope that you will not be get bored. :)
Regards,
Bhagawat.
PS: I want to upload my snap with your book. Can you *please* let me know where i need to upload.
Very interesting concept. Will look into this with my site. Thank you.
If you are using java-script tags to track your visitor how do you break it out by users that visit less then 5 seconds? Would you get an accurate look at the data? Since there is nothing to trigger when the user leaves the site?
Doesn't Google Analysis do this already?
I agree as well and excellent analysis.
Thanks for the post!
Great article.
Tanks for the post.
I have translated this article into Chinese @ my blog here: http://youping.cn/archives/377
I am not sure about the following points, can you explain that in details for me, i am waiting for your email, Avinash.
1.Web Insights.
2.Gives nice context on if we are up or down over a time period and over same time last year.
Thank you very much.
Hi Avinash,
Have the segmentation and funnels setup. Dont have the traffic yet to make statistically significant inferences, but were getting there. Thanks for the advice.
Let's say I want to segment with two parmeters.
Here is the scenario:
*I have a shopping cart and a promo coming up
So, my promo runs from date A to date B
Then I take all my products that are in the promo and I stick to each url of each product in my shopping cart and allocate them a promo code. Per exemple //mysite.com/shoppingcart/productA1.php becomes, after I tagged the promo code to trace it becomes: //mysite.com/shoppingcart/productA1.php_promoGo
How would one go about to begin tracking conversions?
I want to start with a zero dollar value and observe conversion of products that are tagged with my promo code between date A and B.
Any suggestions?
Tks for the personal answer.
BTW, I am going through your book, this is how I discovered your blog.
IMMO, this is a functionality that is missing in GA. One should be able to set the monitization barometer at zero without having to create a new profile
i.e., one should be able to track, within a segment, a group of sku between date A and date B.
I think if GA had the opposite functionality that we find in the *Exclude* Filter found at:
https://www.google.com/analytics/settings/profile_summary?id=******&
It would be usefull
We could then see how promos are behaving on the web versus brick and mortar sales easily set on the GA side and consciously hard and long to populate on the web site being analysed.
Tks again, I'll suggest that procedure to my friend.
Daniel.
This blog post is OLD, but still relevant! Love it!
There has been major updates to GA since this post. I agree that segmenting KPIs is valuable. Not segmenting a KPI is worthless.
Thank you Avinash for being my coach! I'm still enjoying the Market Motive Course.
Please give the linke to the Market Motive Course for a reminder to all.
Tks.
Daniel.
Daniel: Here's a link to the Market Motive web analytics certification course:
http://goo.gl/WpNSj
If you have any questions please feel free to email me, I'm one of the co-founders.
Avinash.
As a newcomer in the digital marketing sphere, I have a lot of questions about how the system works and how we can actually leverage all the data being generated.
Thanks for the information, gives me some clarity.
Hi Avinash, 5 sec on site segmentation is not available in standart Google Analytics implementation so usually I am adding scrolling and time on page script and create different segments based on it – sessions without scrolling, sessions with 15 sec and more etc.
After reading this artlcle I've also added such segment – page depth >= 2 in several ecommerce accounts and realized that 2/3 of people from paid search are leaving website just visiting 1 single page. And I couldn't easily exclude those visitors as traffic may came from search queries which brought conversions. For example search query "buy blablabla" brought 30 visitors, 20 of them visited only 1 page, 2 broght transaction which give 400% ROAS. I've applied additional segments such as age and gender – page depth pretty much the same.Then I've compared mobile vs tablet vs desktop and realized that I have problems with mobile traffic, mostly on Ihone and Samsung devices.
Thanks for your segmentation advice – now I am segmeting everything.