 One of the fun part of my professional life is all the email I get from you. Yes it is an insignificant amount of work but it means I learn a lot about what's on your mind, what you find hard, what you find easy, what challenges bedevil you.
At the moment the "could you help me" / "what do you think I should do" emails are around 50 a day.
[My one small request is that you do a search on www.google.com before you email me, sometimes that also works pretty well.]
Here are some questions from the last couple weeks that were interesting enough to share with you.
#1: Bounces on a "non-bounceable" Page. How Come?
#2: Bounce Rate in Omniture. Why Not?
#3: Decent Funnel Abandonment Rate. How Much?
#4: Rock Steady New vs. Returning Visitors Ratio. Why?
#5: Sudden Data Drop! Help Me!?!
The questions and answers are below, I hope you find them to be of value.
#1: Bounces on a "non-bounceable" Page. How Come?
How can an a page that is not accessible without coming from a previous page can have a "bounce rate"? It should only have an exit rate, isn't it? That page is not a landing page.
This is a good one, don't cha love riddles?
Many people wonder how their page deep in the site can have bounce rates. Or say their shopping cart page, that's usually not even indexed by the search engine!
Here are some reasons I have found for this problem in my experience:
It turns out that people will bookmark pages on your site during their visit and then visit during bookmarks and then bounce! The session already started so you get a "single page view session" and you have a bounce.
More than once the culprit was that people in the company had bookmarked pages and were visiting it as there were changes happening to see if the changes went live or looked good. They see one page and bounce (damn!).
Another time it was that someone had bookmarked it and sent it around on email, all those clickthrus showed up as "direct" and bounce. Ditto for this tweet crazy world (if they short url the wrong page!).
Of course other times you think the page is "unindexable" but not all robots will respect your robots.txt file instructions.
Update: Long sessions can cause you to see Bounces on "non-bounceable" pages. Your visitor comes to your site. Browses. And, say, adds to cart. Goes to gossip for 30 mins. Comes back. Reloads the page. Leaves. Boom! Just caused a bounce. : ) Won't happen a lot, but certainly does happen.
And once, just once for me, a delightful person had set up a program (javascript executing program!) to go ping a deep page in the site to make sure the site was up! Of course that showed up as bounces, but by segmenting that page we found a nice clean pattern and then the culprit.
Those are some reasons in my humble experience. How about you? Have you run into this? What did you find?
BTW if you want to understand the reasons go to your page level analysis reports (in any tool) and look at the Entrance Sources & Keywords, Navigation Summary for clues. Or send a email around your company and ask if someone's been visiting it or had included it in a irrelevant email blast to customers.
#2: Bounce Rate in Omniture. Why Not?
I can't find Bounce Rate in Site Catalyst, can you please tell me how to create the reports you had on your blog / presentations?
It is not even funny how often I get this question.
Omniture does not have the metric Bounce Rate in the set of metrics that it provides by default in the application. Perhaps in the next release it will make the cut.
 Though as you know Omniture can compute anything you want, so you can absolutely create your own custom metric and apply it all the many many reports available to you in Site Catalyst. I know it can be done because I have done it myself.
But I am not an Omniture "expert" so I'll request my peer blogger Adam Greco to write a post on the official Omniture blog that covers two things:
1) How to create the bounce rate metric in Site Catalyst.
2) How to create two reports I constantly present in this context: Top Landing Pages (Visits & Bounce Rates for each). Keywords – Paid & Organic splits (Visits, Bounce Rates, Conversions).
I'll link to Adam's post when he writes it, and then I'll have a link handy to send to all of you ask me how to do this (so often!).
[If you are a Omniture Customer you should regularly be reading Adam's Inside SiteCatalyst blog, it is very good.]
Update: Adam has very kindly responded to my request, here's his post: Bounce Rates [Inside Omniture SiteCatalyst]. Thanks Adam!
#3: Decent Funnel Abandonment Rate. How Much?
What is the best way to tell when you are performing well with your funnel reports?
I understand that funnel reports can be used to find leaks. Obviously you will never get 100%, but how can you justify when your pages are optimized good enough?
No complaints? There has to be a better quantifiable way.
I love this question because we as Analysts (/Marketers) tend to obsess about things and don't often think of the law of diminishing returns.
It is important to know that how low can you go often depends in the type of business, and it also depends on the type of funnel (for some you want to get to 5% if you possibly can).
If you are doing this in a dedicated way then I encourage you to plot the funnel abandonment over time.
You'll start to see that initially, as you move from 80% abandonment to 60% you can probably do that quickly. Low cost.
It will be a bit hard to move to 40%.
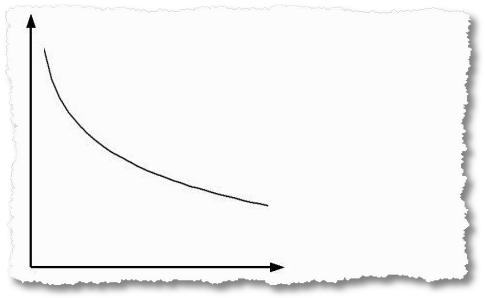
Then you'll start to note that with time (and effort) your graph is flattening out, say at 30%.
That's probably your point of diminishing returns. At this point you can do a cost benefit analysis and see if its worth it.
If you want to do more then you should "segment like hell" (different traffic types, offers, campaigns what not) and try to find improvements you can make for specific sources (for us it was affiliate traffic!) and move away from the aggregate.
Once you apply this type of thinking you can optimize for your own internal maxima and move on to other bigger things (remember there is no shortage of good work).
#4: Rock Steady New vs. Returning Visitors Ratio. Why?
I'm stuck in one area. For our major media site we have a consistent ratio of:
New Visits: 25%
Return Visits: 75%We want to grow, but also maintain a healthy growth cycle. Our overall visits, uniques and pageviews have been increasing by about 10% month over month, but we are still maintaining the same new vs. return ratio.
Do you have any insight on what a healthy new vs. return ratio is?
Another riddle wrapped in a enigma. : )
The healthy ratio for any site will depend on so many different factors. I have often stressed that what works for best buy does not work for circuit city (well at least not any more!).
Hence it is imprudent to think that there is optimal ratio to shoot for.
But in the case of this media site my suspicion is that while the overall ratio stays the same (while page views are increasing) the ratio of different visitor segments might be shifting quite a bit.
So step #1 would be to look for the ratio of New vs Returning Visits for the search traffic (paid or organic) first, because for so many media sites search dominates acquisition strategy.
Then also look at the metrics for top referring urls, same idea.
Take the investigation a step further and look at the content consumption for different parts of the website. Do more of the New people read the Op Ed and for some reason all returning people read entertainment news?
Something like this…
![content vs visit distribution[1]](https://www.kaushik.net/avinash/wp-content/uploads/2009/02/content-vs-visit-distribution1.png)
[See this post for the story behind the above picture: Deliberate, Dig, Understand, Throw A Feast!]
I would really drill down in various sections of the web analytics reports to see if I can find segments that might be attracting and retaining new (or returning) visitors.
As we have frequently harped on here, looking at the Visitor Loyalty and Recency reports can be very actionable.
Net net at the end of the exercise:
You'll get a understanding of if the overall is telling the truth of there are pockets where the ratio is very different (and why?).
Looking at content consumption will help you understand what the patterns are for various types of content.
Fun!
#5: Sudden Data Drop! Help Me!?!
I have had a web analytics tool on my site for some time. I am curious because my numbers go down rather than up even though I get a reasonable amount of views to website.
The numbers went up to about 800 and then started to go down again. Now its at 450 ish.
Also countries that once showed having had views no longer do. Can you explain this to me please? Thank you.
I share this with you to impress upon you the enormity of the tasks that get trust on me.
As you can imagine there is no way that I can answer this question (and above is 100% of the information I have!).
But I did try. Here's my reply. . . .
There is not enough information in your email to explain what might be happening. My recommendation would be that you reach out to your web analytics vendor and share your website and other details and perhaps they can shed some light.
But when I look at things like this I start with the referring urls report for the current month and the one before to see if any referrers have unusual drops in traffic, ditto for search engines and keywords.
If any campaigns running before have expired now – that can also cause your traffic to drop by lots very fast.
Finally if the javascript tags have disappeared off the site or are missing from any newly launched pages that could also be an issue. Check with your web master / tech gods if any major launches have happened (or they got rid of your tag because the footer is gone).
See I tried.
What would your advice be to this kind soul?
I would very much love to have your feedback on all five issues. What did you think of my guidance? Do you have a different answer?
Ok here's a challenge: What's the toughest web metrics / data / analytics question you have ever gotten?
If I get a bunch maybe I'll pitch and see if I can answer some. If. : )
Thanks so much.
PS:
Couple other related posts you might find interesting:


 Via
Via 


Hi Avinash – another great post here. This really highlights the detective work and the investigative work that is necessary for analytics directors / managers on a daily basis. You never know what type of questions you will have waiting for you each day. Some you can answer in your sleep – others leave you banging your head against the glass window. But there is ALWAYS some explanation at the end.
For #1 – Bounces on a non-bounceable page – I usually find that the culprit is in fact search engine robots – most people don't bother calling a robots.txt in those interior site pages, and a lot of times they have meta tags.
For #3 – I agree – there is no "magic number" (like with Bounce Rate) that anyone should strive for here. Some common inflation factors of Funnel Abandonment include log-in pages, "create a new account or die!" type pages, and pages that refresh / reload when you enter in information (happens a lot in Ecommerce situations – you fill something in, like your state or zip code, and the form refreshes – depending on your tool, that can count as an abandonment and then a re-entry).
For #5 – Whenever I get a question like this – or anywhere within the ball park of this question (data drop, data spike, data discrepancy, missing visits / clicks, too few X, too many Y), there are two immediate things I do before anything else: 1. Tracking Code, 2. URL Tagging. I have found that probably 7 or 8 out of 10 times, one of those two areas is going to answer the question (a new page uploaded and not tagged; a page edited and stripped of code; redirects stripping the URL tagging; URL tagging done wrong, coding on page(s) done wrong). So I guess I work in the opposite direction from you – I start with the mechanics of it, and then when that checks out I start digging in to the PPC Campaigns, and then if that checks out, I start digging into reports.
Sometimes it feels like I should be on an episode of CSI Miami :). I'm sure most people who manage or are in charge of web analytics will feel what I'm saying about that.
Thank you!!
You say that finding a healthy ratio of returning visitors to new visitors depends on several factors. Can you give general examples of what some of these factors are? Of course, they will vary, but what are the most common ones? Also, what is your best tip for deciding how much time to allocate toward luring in new visitors versus making your site familiar for the repeat visitors? Is there any overlay here?
Hello Avinash
I am a Japanese web analyst living in Japan, and I enjoy reading you post. So I thought I will try this challenge.
I will aplogize for my poor English in advance.
#1: A minor reason which I thought of is "Browser settings which prevent Cookies(so it is impossible to join pages)" or "for some reason, someone decides to post that URL on their blog,twitter etc.."
#3: Of course 100% is impossible.What I usually advise is to look at the "near the end of the funnel".Especially entering forms or shopping cart processes. If there is a great drop this is the first place to change things. Also funnel abandment rate can be highly effected by campaings or promotions so it is important to exculde these factors as much as possible when doing a time-line analysis.
#4: As written in the article, rock-steady rates usually is a result of many up's and down's adding up to 0. So it is important to segement things and find these "up's" and "down's" .People entering the site via e-mail (and "no referrers")will obviously have a high repeat rate compared to the average etc…
#5: I will probably go the same pathway as Joe, written in the comment above. From my experience, a sudden drop usually results from Human error(tagging or settings).
And here is the most difficult(or difficult to convince the person questioning)is
"Why is my SiteCatalyst(or another tool) data different from my Google Analytics data/apache log file/number shown on adwords/ report I get from my client/ etc…"
Not technically difficult, but a pain to explain.
Once again, I enjoy you blog very much. I will be joining Mindmeld and the Omniture Summit next week, so I hope I can meet you there:)
"I’m stuck in one area. For our major media site we have a consistent ratio of:
New Visits: 25%
Return Visits: 75%"
If traffic is growing, what's the problem?
I agreed that the bounce rate report is not available out of box in Omniture Site Catalyst and wish it was. We calculated the bounce rate metric using the Omniture formula [Single Access] / [Entries] and added this to the calculated metric. Once you have this new metric you can add it to the pages report to see the bounce rate for each page. Just created a blog post explaining the same.
Hi Avinash,
A couple of thoughts on your latest FAQ.
Q&As number 1 & 5 – your answers make perfect sense. I learned from the scenarios you shared on item 1. Thank you!
Q&A #2 – I'm not an Omniture user so I have nothing to contribute to your answer. I have added Adam Greco's blog to my Google Reader with the thought that I could learn something from his blog even if I'm not an Omniture user. Your endorsement that it's a good blog is all of the encouragement I needed.
Q&A #3 – I like your reference to the law of diminishing returns. Great reminder of a great concept…and thanks for the bonus link to wikipedia for more information!
Q&A #4 – Thank you for the reference to the prior post (Deliberate, Dig, Understand, Throw A Feast!). I hadn't read that one before and your handy-dandy link to it was appreciated. I like that Content vs. Visit Distribution chart. It reminded me of your other blog posting titled The Three Greatest Survey Questions Ever. I thought about the question you like to ask visitors 'What is the purpose of your visit today?' If an analyst has access to qualitative data answering this question, creating this chart should help validate the qualitative data….and may lead to some insights.
I like all of the images that you add to your blog posts. I don't always pay much attention to the details of them, but there is great comfort to me to have them there. Somehow the colors and imagery help make your postings more exciting to read versus other blogs that are mountains of text. They help to visually break up the text.
Alice Cooper's Stalker
Hey Avinash,
You've been one step ahead. I was planning to have the "bounce rate" post for tomorrow, but it looks like I had to post it today.
Other reasons that may influence the bounce rate on "unbounceable pages" can be:
– visits longer than 30 minutes (when visitors will spend more than 30 minute on those page and then reload the pages they will start having a bounce rate).
– cookie and privacy settings changes while visitors are navigating on your website.
Interesting post as usual. The question #5 is a classic. Sometimes people have difficulties to 'accept' that it can sometimes go down naturally (without any technical problems behind): seasonal trends, competition doing a lot of advertising, end of campaign activities…
still they come to you saying "my traffic went down significantly, can you check the tool, there must be something wrong". Well, not always. that's life.
The other classic I sometimes get is "we are doing a campaign, I get 150,000 visits landing on the microsite but on second step (e.g. after the intro animation), there are only 50,000 visits. How is that possible? Is the tracking not working?". 80% bounce rate is not really what people expect but it happens… too often if you ask me.
@ Taku Ogawa about the "why my figures do not match between A tool & B tool?". so true. I stopped counting how many times I have been asked. :-)
Michael
Rachel: For my blog for example the % New Visits stays much higher then you would expect. But in my case it is ok because people simply sign up for the RSS feed and never come back (except to comment) and that is perfectly ok.
In another case there was this business where their core way of existing was to get new people, get orders, not worry about any future thing, get more new visitors. Dumb business model but the ratio depended on that.
Seasonality can have a huge impact as well. For one of my last businesses from Sept 15 to Oct 30 Returning was nearly 90% because it was all the existing customers coming back to upgrade and all the new people would come when we sent out promos (in Nov, Dec).
In the example in this post it was a newspaper site and I can easily imagine how the mix ratio for NY Times would be vastly different from, say, TMZ. Campaigns, Customer Types, Search efficiency, RSS availability and more.
Hope this helps a bit.
Ogawa-san: Thanks so much for your note, your English is great.
Some thoughts on your comment:
1. You are right that if cookies are not going to be accepted that could cause the bounce. But some programs fall back on stitching the session based on the ip+user agent id string and others, like Omniture, will not even report on those "hits" (from those that don't accept cookies). So it is less likely but certainly can happen depending on what program you are using.
3. I concur with you that starting at the end of the funnel can be a good option – I like to say something like "look they made it that deep into the funnel, the visitor now just needs a warm caress to get them through – give the caress!". : )
With regards to your data reconciliation challenge here is a recent post I had written as a checklist of things you could follow to get nail down the differences:
The Ultimate Web Analytics Data Reconciliation Checklist
I think that article might be of value in your quest.
Gary: The traffic was growing, you'll see in his question he mentions page views were growing by 10%. His expectation was that that meant more new people were coming to the site (hence increased content consumption) but the ratio was not moving at all.
He wanted more New Visits to show that his acquisition strategy was working and that the business was growing.
Makes more sense now?
Alice Coopers Stalker: Thanks!
With the pictures I try to convey a particular concept or emotion. It takes a lot of work to find the "perfect" image, I am glad that at some level you find it to be of value.
Michael: I wanted to write about this in the post but at the last minute I did not. I have become a bit jaded about the first words being: "Omniture is wrong. Google Analytics is broken. WebTrends has a bug." And so on and so forth.
Yes tools can be wrong. But all things considered I would not start there.
Look at the implementation.
Tap into the tribal knowledge (what is the business doing / has it stopped doing).
Now blame the tool. :)
-Avinash.
Great post. Thank you!
Here my two cents about #1. Maybe the previous page is missing the tags? Can this be affecting this data? I guess it depend on the tool.
Avinash,
Great post.
#1: bounce rate data on "non-bounce-rate-critical-pages": I think having this data creates noise in GA reports. I simply focus on bounce rates of all landing pages (segment and chop this by traffic source etc), keywords, referral traffic so on so forth and optimise, and test and possibly optimise a bit more…the ring of "joy" (optimism is key!) :)
#4: New v Returning: i agree with you that there's no real set ratio. I find that keeping one's thinking simple is best with this stat. If your new visits have the highest conversion rates, focus your efforts on converting more of your new visits from browsers to shoppers/converters (segment/dice/slice and eat!). If you're a content only driven site (BBC?), then returning visitor data (not only the overall %) is crucial. If pages/visit are low, time spent and all that lovely data isn't showing up as green – then KEEP YOUR SITE FRESH MAN!
My question:
We use event tracking to track Flash media player events – play, pause, full screen etc (all the good stuff) and add in the value parameter to track time but GA only shows average time (yawn!) :).
Is there a way of showing unique video play times? or is it a simple case of investing in the likes of Visible Measures or any other decent video tracking software?
Just to add that tracking events in Adobe AIR / FLEX with GA is a gem…segmentation in GA also puts a smile on my/clients' faces (sometimes)…
Steve
Steven: Love the "ring of joy"! :)
For event tracking Analytics will provide you with a total and the average of the event value. I see folks typically track quartile events (start, 25%, 50%, 75%, 100%) to measure abandonment.
In terms of tracking RIA's or Rich Media experiences I humbly believe that we (the tracking industry) are at the very evolutionary stages. There is a lot of cute stuff going on but it will take a little while for it to settle and get standardized. That is perfectly ok.
I see the role of Event Tracking (from GA) as simply providing a flexible and scalable architecture where you can store "interactions" that are relevant to your business goals. In as much it is not uniquely created for every specific use (say video tracking) and yet it useful for pretty much everything. :)
But as users do more, as the team learns more (evolution!) it would not surprise me one bit if there are specific strains come up for specific uses.
Does that make any sense?
-Avinash.
Nice post Avinash thanx again. I can't believe that an analytics tool does not have a bounce rate as metric. In our tool Speedtrap we made a segment called bouncers so we can use this group in all our reports. Such as Campaigns and our Keywords from Search. After reading this post I will also make a segment about returning and new visitors.
Thanks for the insights again en hope to see you again in the Netherlands.
PS sorry for my English just was not one of my best things at school.
Hey thanks for the brilliant post! The resource will help me that for sure.
Just wanted to add one thing. Me and another Ninja (Jeroen Sijbom) made a matrix called the online middelen matrix. Here we use indexes to put all the different resources in the matrix. We use traffic and conversion as the axes. For us it is a great way to see what the mix is doing and our position online (against budget). Its a compuound of two metrix put into one picture. You can see it at
http://webanalytics-vandatanaarkennis.blogspot.com/2008_10_01_archive.html
love to know what you think of it. PS normaly you can alsoo see the label of the brand in the matrix to see where you stand in total.
Great stuff as usual.
My latest mission to go back over a longer period of time and find our best performing keywords over a period of years as oppose to a month or smaller timespan.
Because of the volume of phrases with all the long tail etc it is quite difficult to take in.
In most cases the high conversion phrases are the long tail where perhaps 2 conversions have come from just 2 searches, so sorting this way means scrolling a further five hundred keywords to find the higher conversion rates on the higher search numbers.
Is there a way of sorting this list out so that I can only see traffic of a certain volume organised in a conversion value order?
what I mean is, you can sort the lists in GA by conversion value or you can sort by traffic volume. However I want to only see traffic of a certain volume but still organised in this conversion value order? Does that make sense?
i.e Is there a way to filter this so that I only get keywords that have sent more than 100 visits in a time period ordered by conversion values. only?
Thanks and sorry if this doesn't quite fit this post
Conference Coordinator: You should be a bit careful about using keywords over a period of years.
I think you are ok with your brand terms (head) but Google has said that a astonishingly high number of key phrases each day have not been searched before.
So for your long tail if you go into years there is a sad possibility that is not a good use of your time. Just be aware of it.
In terms of trying to get your hands around this data….
I like this extension for firefox:
http://www.juiceanalytics.com/writing/keyword-trends-google-analytics-greasemonkey/
It highlights keywords and key phrases that have shifted the most.
The same wonderful folks, Juice Analytics, have a product called Concentrate that is also wonderful for just this type of use:
http://www.juiceanalytics.com/writing/target-long-tail-searches-keyword-patterns/
In terms of better sorting I think any Google Analytics user should have the Better GA Extension:
http://www.vkistudios.com/tools/firefox/betterga/index.cfm
What you are looking for in there is Andre's GA Table Sorting feature. Really nice.
And always remember if all else fails there is Excel, you can do anything in that tool! :)
-Avinash.
Thanks for your thoughtful and in-depth reply Avinash. Really helpful.
Its funny really cos I have used all the web design tools, frontpage, expression, macromedia etc and over the last few years, pdf's and hosted reporting tools etc like GA but not for more than ten minutes have I used Excel and that type of office related software. Call me old fashioned, I was always of the belief that that was secretary stuff haha
Perhaps I should add it to my 'to master' list for this year.
Thanks again.
Regards
p.s
The https://www.concentrateme.com/features/ Concentrate links are all added incorrectly on their page. They have linked to the https secure page for anyone that visits.
Avinash, seeing as you are reading my posts anyway.. there are one or two sites that you recommend, for example the awfully named '4Q' ('fuck you' to us europeans, for a customer service name?!) and altho useful a lot of these scripts etc that they use rarely validate in the code, throwing out dozens of errors.
Being an analytics expert yourself I would have thought that you would see the value in clean code and be more likely to encourage the practice.
:-)
Just a follow up to say that I installed the fire-fox add ons that you recommended and they are great. The one in particular fulfills my exact desire of sorting only the important lists (to me).
The only problem still revolves round the 'concentrate' site where it simply fails to accept our data for validation. i.e it says to give a specific value from the GA reports but it wont tally up) (and their website needs some serious usability tests, lopping links etc)
Thnx again
As always Avinash top-notch tips, and insight into bounce rate issues. I was always wondering about those mysterious Bounces on a “non-bounceable”. Btw I love the Firefox ext you recommended.
We do a lot of web sites for hotels, and one of the primary conversion steps is for the visitor to click into the booking engine, which is a different URL/site. This step is crucial for us, but it effects bounce rate in Omniture I believe. We do have it open in a different tab though — is that considered a bounce also?
Thanks — by the way, love your stuff and I've been passing it around the office all day today.
David: If I come to your site. Click on a link to go to the booking engine. That is not a bounce.
In Google Analytics for example the exit link (like the booking engine) is encoded with a piece of code like this:
onclick="javascript:pageTracker._trackPageview('/goal/feed')
then it automatically not counted as a bounce.
In my case the above code tracks the link that goes to sign up for my blog's feed which happens at feedburner.com.)
You should ask Omniture how to do something like this. I am positive there is a way to do it.
-Avinash.