 Save the best for last! Insights for Search is one of the most awesome research tools you'll use. I promise.
We have learned how to use Trends for Websites to measure core site metrics and identify strengths and weakness of our competitors.
We built on that by learning how the Google Ad Planner can help us identify demographic and psychographic attributes of the Visitors to our website, as well as our competitors. Not willing to stop there we also identified specifically how to identify Publishers where our target audiences exist, to aid in our intelligent acquisition efforts.
In the final post in this series we cover Google Insights from Search and go back to good old keywords and mining search behavior by our customers to find actionable insights.
Given the dominance of Search as a acquisition channel, you are going to have fun here.
Do the obvious thing first: Understand "head" keyword trends.
Type in a keyword and check out the trends over time, a quick peek into popularity of the terms you are interested in. . . .
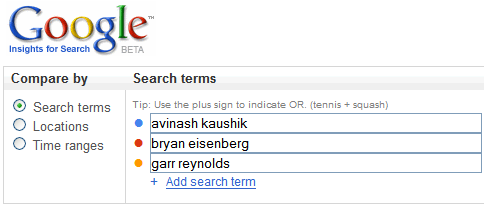
Step One: Type keywords. [I am going to compare volumes for my friend Bryan Eisenberg – Always Be Testing -, Garr Reynolds – Presentation Zen – and myself to see if I can learn anything.]
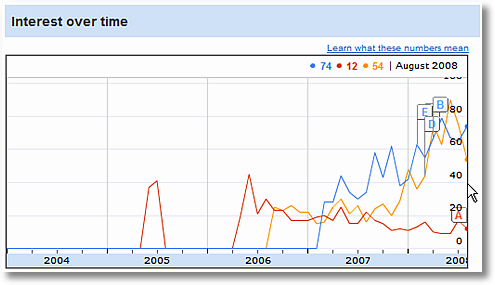
Step Two: View Data.
Some quick thoughts.
Bryan's search traffic has stayed pretty consistent over time, steady over the years even as the "noise" in his unique space, persuasion architecture, has gone up quite a bit. There is a slight lower slope in the last 12 months but overall Bryan has great strength.
Garr shows up on the scene in late 2006 and you can see him stay steady and then in the latter part of last year he announces his book and you can see his plans for world domination take off like a rocket, over Q4 and he is not looking back (except in the last month).
[What do the numbers mean: The numbers on the graph reflect how many searches have been done for a particular term, relative to the total number of searches done on Google over time. More here.]
Remember always look at your data in context, hence the slope of a individual line is important but it is in context to the other lines that it gets to be more fun.
What can I do with this?
Run the graph above, atleast for all your head search terms (top 20 terms that bring most of the traffic) and see if your indexed performance (against competiton) is good or bad.
Notice those three numbers on the graph above (74, 12, 54)? You can even report monthly performance in your Management Dashboards.
You can also use these trends to validate your business strategy, unaided (or aided) brand recall, customer intent. (Or feed your paranoia: Do you matter!)
People how know me know that I love my ThinkPad (greatest laptops in the world!). You also know it used to be owned by IBM and is now Lenovo.
So I wonder how the ThinkPad brand is holding up over time vs the Lenovo brand. . . .

Good news on the Lenovo front. From no where the brand has continued to grow strong, as reflected by customer searches, and on a great slope.
Potentially not so great news on the ThinkPad front (me so sad). The brand has continued to erode steadily over time.
This should potentially be worrying because during the same time the business brands of HP and Dell laptops tend to hold steady in terms of search volume (though Dell's seem to on a slightly over time).
Remember all this data can do is raise questions. It could be that Lenovo is being emphasized over Thinkpad, it could be that the competiton has just stayed steady on message with their brands, it could be a reflection of Lenovo's search strategy, it could be that Lenovo believes that its core direct business strategy is so strong that the web one is not quite as important.
So what's wrong? That's for David to answer (in private I am sure :).
You can also use this kind of data (from Google or another source) to measure what kind of brand equity you have built over time for your core business brands.
Here's a example: I was embarrassed that I did not know Lenovo did desktops, I recently ran into the ThinkCentre PC's ("The ultimate business desktop") on their website.
So I wanted to know if I was the only person in the world who did not know this. Here's the data. . . .

Either by design or by fate, it seems that very few people have heard of ThinkCentre PC's – as measured by people actually typing in either ThinkCentre or Think Centre into www.google.com. That inspite of the fact, you'll note the orange alphabet markers above, Lenovo has been pumping out press releases and news about the product.
That's what you can do: interesting analysis about your core head terms. Analysis that helps you index your performance and raise troubling questions.
You can also get a bonus based on this data, for example Seth (who runs search strategy for the green line) probably included this in his annual performance review. . . .
: )
Google Insights for Search offers a large free source for all this rich search data, but even if you use paid solutions from Compete or HitWise you should be thinking in terms of similar analyses.
Kick it up a notch: Exploit geographic customer demand trends.
Comparing trends over the last four years is just one part of what you can do with Insights for Search. The other large component is your ability to understand them from a worldwide perspective and along geographic segments.
Continuing with the Lenovo theme, let's try to understand opportunities for the X300 (which I really want!).
I start by trying to understand customer search behavior across different countries for the term lightweight laptop (the blue line is for "ultraportable laptop", not quite as popular). . . .
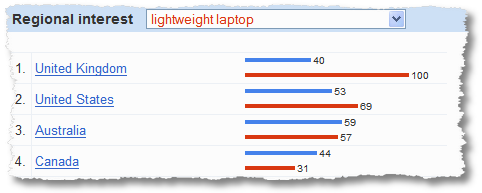
Amazingly the US comes in a bit behind the UK in terms of the search index, an obvious market to exploit. But what about rest of the world?
Here you go. . . .

Sweet. Three countries stand head and shoulders above the rest, as is obvious. It is surprising to me that Japan is hot much more obvious given their obvious propensity for small stuff.
Also notice Philippines and Malaysia show up nicely.
If I were running Lenovo's search campaigns here is good data for me to profit from: The demand is there, are we showing up in Organic and Paid Search results for these terms?
But it gets better.
You can actually drill down to individual country level and then state level to further understand search behavior.
For that I tried something different.
While the Macbook Air is not a direct competitor to X300 (you see there are Mac people and then there are PC people :) it is possible for us consider understanding its popularity and try to be aggressive and provide the X300 as an option to those folks.
[It is to be noted, perhaps unsurprisingly, that way more people look for the Macbook Air than the X300.]
Here's the geographic search volume index map for the X300. . . .
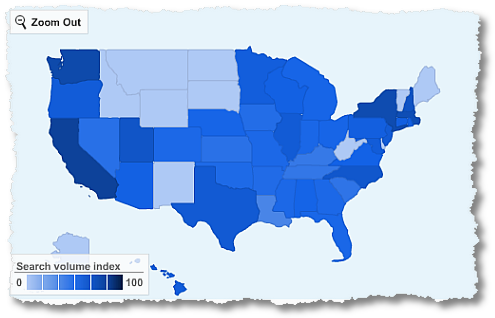
Significant search volume (indexed) on the coasts, Texas and NYC are strong (and I wonder why North Carolina is strong :)).
So how does that compare to the demand for light weight computing as represented by the Macbook Air?
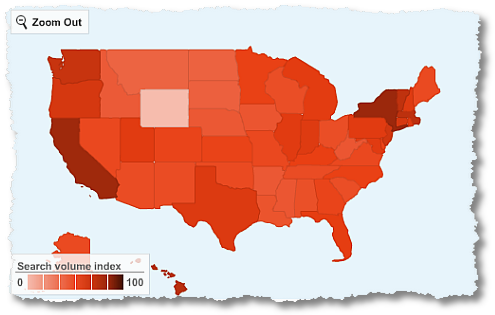
You see strengths in the same states as the X300, but there is pretty nice demand across the country, all states (except Wyoming, what's up with people in Wyoming?).
So clearly there is demand, but people are not looking for us. Clearly great opportunities for a aggressive Marketer at Lenovo to exploit this difference and build demand for the X300.
She/He can obviously use Organic or Paid Search on Google. But in those empty states up top for the X300 the Marketer could just as well consider doing TV or Radio or Print or Newspaper or even buy geo targeted banner ads on www.yahoo.com to get the brand out there and get in the face of those people who are looking for light weight computers.
Bottomline: Insights for search exposes customer demand across geography, you can use that data to optimize your online and offline campaigns to benefit from that demand.
It bears saying that this is not some phone survey data by bugging people at dinner time, this is not panel data extrapolated to infinity, these are not online surveys. These are actual queries typed by actual people who are actually looking for you (or your competitors). You can see how it is vastly superior.
Go for gold: Ecosystem: Identify "related terms", "rising terms".
As all good SEO girls and boys know it is not all just about the terms you are interested in, it is all also about the ecosystem related terms if you really want to win the search game big (on any search engine online).
I have stressed quite a bit on this blog about moving beyond the top 10 or top 20 (tip of the iceberg) to what's happening in the massive long list of keywords (below the tip of the iceberg, hidden under the water). Statistical techniques like "what's changed" are fantastic at this. I am quite pleased that Insights for Search offers a "what's changed" view as well!
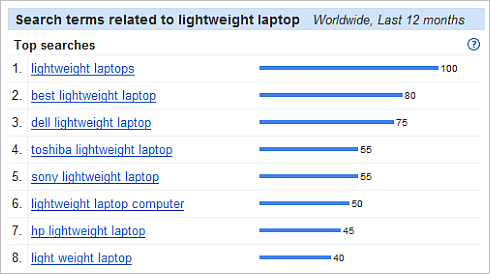
Since we were just working on understanding lightweight laptops, here is the first nice bit of insight from the tool. . . .
Two action items.
1) You can ensure, if you are doing SEM, that you are taking into consideration all these related terms to ensure your bidding (or even SEO) portfolio contains the right terms.
2) Every time I find competitors here, and not myself, I feel a bit sad. Clearly in this category Users are typing competitor terms and that is sad (Ok, ok I am religious. Ok, I am happy for them. There. Happy now?)
You can see how this can give you insights across other categories, and customer preferences. Remember our use of Pampers as and example last week in the Ad Planner post? So how is the picture for diapers?

Someone at P&G should start worrying that cloth diapers is so huge in this category. You can easily see how the numbers above reflect the individual success of Pampers and Huggies (the two big brands here in the US).
Related terms are good to understand. More awesomely awesome are "rising searches", terms that are not quite yet in the top but are rapidly becoming important in this category.
Here's the story for our lightweight laptop category. . . .
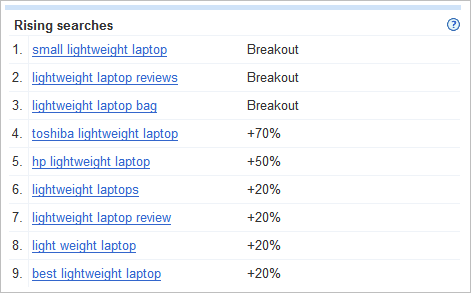
Whatever it is that Toshiba and HP are doing in terms of their online and offline campaigns (branding or otherwise) is clearly working because terms with their individual brand names are rapidly rising in customer conscious (and hence them typing into search engines). I
Beyond that at the minimum what this list offers are keyword and key phrases that you might not have considered but you should.
Rising searches to me is also a fantastic way to understand trends that will become mainstream in the future, but currently are just rising. So not only do people want lightweight laptops, they also want them to be small. As an example.
So what about our diaper category?
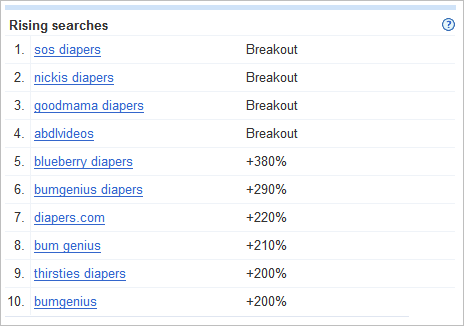
Someone at bumGenius deserves a raise, it is astonishing how much they dominate the tidal wave of rising attention at the moment. Clearly the environmental movement is catching on.
None of the main brands are present there.
Perhaps P&G should buy bumGenius to preserve future revenues. :)
I have to also admit that I had never heard of any of the diaper brands above, a reflection of how some of these trends are so hidden under the radar and then end up surprising Marketers when they hit mainstream. By then it is too late.
Bottomline: Use the data above to identify bleeding edge trends for your industry, key words, ecosystem before it is too late.
Some last goodies: Time Range Trends, Locations & Categories.
Couple more fun things you can do with Insights for Search. You can more view trends for different time periods.
I am going to check the performance of my brand over two years and if I am getting better or worse. . . .
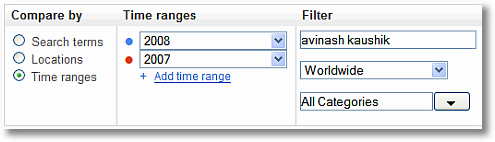
Click Search and. . . .
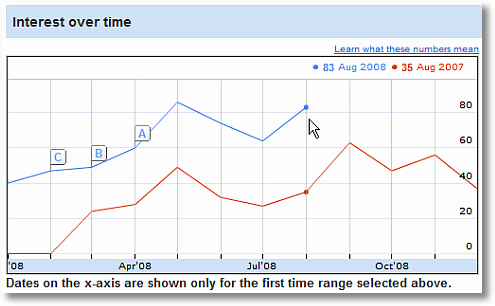
No presence in the Jan 2007 time frame (why! :)), and doing much better since then. Doing much better year over year. Happy birthday to me. :)
It is interesting to see the dips over summer. I wonder what causes that (any guesses?).
Do this graph for all your core brand terms, for your category terms, for your performance for your industry "rising terms". You'll have insights up the wazoo.
Another example. A real business. From my visit to P&G, year over year performance for one of their biggest worldwide brands (one of their biggest advertising spenders offline) Gillette. . . .
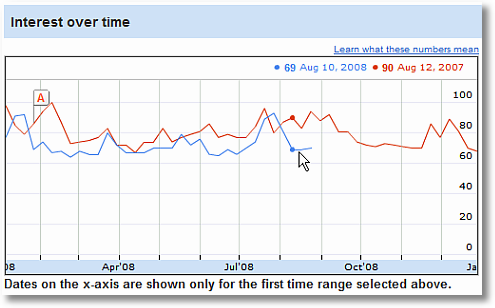
Quite sad.
So much money spent hiring Tiger Woods, Roger Federer and Thierry Henry, so many very nice tv commercials, and so many nice print ads. But online they are doing much worse year over year.
I bet for the cost of airing just five of those TV ads Gillette could easily reverse the trend above, if it really set its heart on winning online.
Switching gears.
You can also do category searches in insights for search.
So what are the terms that are top in the Auto Insurance category in the US?
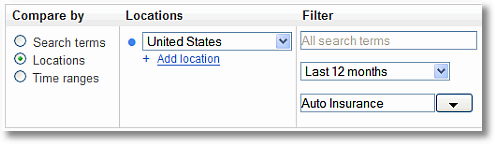
And boom!

Delightful, right?
And don't forget to look at the Rising Terms, that's where the real meat is. Motorcycle insurance is rising, travelers and nationwide are both rising brands (good for them!).
Finally you can also do some fun stuff.
I did a search on the "hottest" (rising searches) celebrities (category: entertainment, sub category: celebrities) in New York in the last 30 days to see how much I am in sync with popular culture. . . .
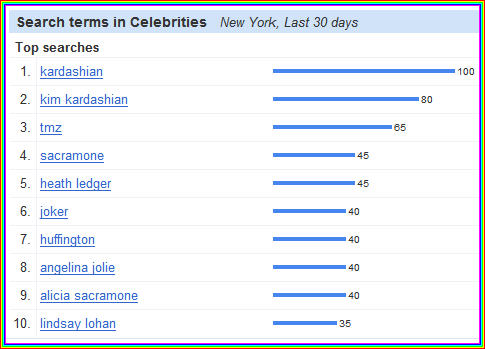
Who in the world is Kim Kardashian? I feel lame, I am so out of touch.
Oh here are the ones getting hot in the last 30 days. . . .
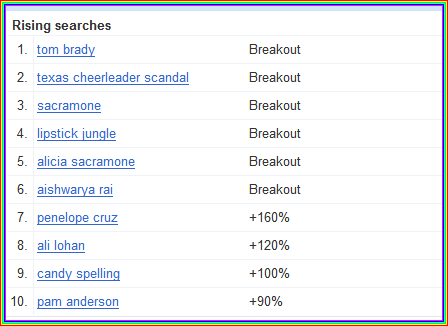
Go Tom Brady and Aishwarya Rai!! And some things are evergreen, go Ms. Anderson! : )
Do I need to explain how you can use this data for business purposes? Think hottest hotels or business schools or computer software or web hosting providers or charitable causes or . . . . well you get the idea.
Agree, pretty damn cool and actionable?
I hope that your have learned how to leverage Insights for Search for your business, but more than that I hope how you can use the techniques in any tool that provides search data (like Compete or HitWise).
Before we close, some helpful links:
- Google Insights for Search Help Center
- How does Google Insights for Search work?
- What are search term matching options?
- What do the numbers on the graph mean?
Ok your turn now.
What do you think? Was it fun? Did you learn anything new? Did the business cases I used make sense? Have you used the tool, what did you not like about it? Anything obvious that I missed about how to use it? Do you use other tools to get this type of data?
Please share your feedback, ideas, and critique.
Thanks.
PS:
Couple other related posts you might find interesting:


 Via
Via 


I like Google Insights alot but I think it lacks a key element in explaining to the user HOW it works.
I've seen dozen of blog posts of people touting all kinds of interesting data insights but I keep thinking about one thing over and over that stops me dead in my tracks on this tool.
Its only based on what people SEARCHED for.
Its not whats happening out there in the world, its not all of the web- whats on everyones mind, it only accounts for what is actually typed into a google search engine to find.
You may say, well yeah duh, but its just not clear enough. People associate Google with all of the web these days, or all of the planet, they are like the answer, and because of that placement up on high so to speak I feel like they take some liberties in leaving out some tiny bit details like hey folks, this is only as good as what people actually typed into me!
Other problem I see is that the tool tells you less of how people search and really puts it on your shoulders to figure out the special sauce of that process. Do your consumers think in key words, more jointed phrases or terms, or are they struggling with language to find your offer? .. find you? I mean Insights can't tell you that, it only spits out what you tell it to spit out, and that seems less insightful if you ask me.
I also get stuck on things I know I found without ever accessing Google. I heard about twitter, went to twitter, and used it. My trail of events never touched your search engine, my results shouldn't be apart of your data set, how many other people had an experience like me and are there for not part of your data set?
It is what it is, and lately everyone is hot to tell me that Insights IS what it all is, and clearly its not that.
Good tool but it needs to be more clear on what its doing and how it serves it up, because otherwise you're just making lots of big assumptions.
In your post you were wondering why Japan is not showing up on the map for the search term "lightweight laptop". I think this is quite easy to figure out. You probably have used the wrong search termn. ;-)
I assume that a Japanese fellow searching for a "lightweight laptop" will type something like "軽量ノートパソコン" (I have used an other useful Google tool for this: http://translate.google.com/). So no surprise here.
In some countries "notebook" is used more common than "laptop", so if you add searches for that you will get further insights. And then there seems to be a high proportion of people who search for "light" laptops / notebooks instead of "lightweight".
So the language and regional differences have always to be taken into account.
Love ThinkPads too! Although I changed my X61 by a T61 last year and got a bit disappointed…
Great post, very insightful.
Avinash – thanks for the free publicity for Lenovo! Great post, and now you've given us something to dig deeper into.
As a person who is just getting into the SEO/Web Analytics industry, this is great advice that is not cluttered with fancy words and things i cant begin to comprehend. Thank You for your great insight!
Great Post.
I agree with Dan's comments. It's one thing to know what terms people searched on. It is definately an indicator of brand equity if you know that your brand name has been searched on 12 billion times over all others. But why are so many people searching for your brand? Are they interested in researching your product? Are they interested in finding a place to buy your product? Are they looking for product reviews? Are they looking for places to bash (ouch!!!) your product? It would be great if google could take this a step further and tell us where the most popular destinations are for people who searched for Huggies and break that down by percentages and numbers. What percentage of people that searched for Huggies went to this destination versus that destination? It would be great to get that same information for monitoring 'what's changed'? Let's say your product went through a recall a month ago. Searches for your brand may have skyrocketed. If you just look at the data…your brand skyrocketing could be a positive thing. They reality is that it isn't. But where are people who search on your brend name ending up? Are they ending up at your corporate site that has good information about the recall and instructions with a carefully crafted corporate response on the topic? Or are they going to a blogs or other sites to vent their frustration at your brand? I guess what I'm looking for might be considered a conversion in the search realm. Through your own analytics tool, you know where people are going on your site. Where are they going in the greater world when they perform a search on your brand? Is it someplace that is positive…or is it someplace that is a negative?
Sorry Avinash, I'm really into this post and think it adds lots of value. I'd like to see the tool go further. The conversion…where they went…helps provide truely valuable information. If somebody just types in Huggies, it really doesn't help you understand intent.
Dan: This is one piece of the puzzle. Something that cost you $100,000 to look at it now free. But like the alternatives, it can't answer every question, it can't be the only tool you use and it can't make you coffee. : )
It's perhaps relevant to add a quick review of my Web Analytics 2.0 mindset:
Competitive Intelligence provides you important insights into the "What Else".
Here's an example. Did Lenovo know that the ThinkPad brand had degraded this much in terms of people looking for it? Most clicks on searches for ThinkPad go to other sites, not http://www.lenovo.com, so they might not have known the starkness of the problem. Now they do. That's "What Else".
It is one small facet of the puzzle. You also need to understand the "What", the "How Much", and the "Why". Then you have a better understanding of the picture, and if you use it then you'll set yourself apart from your competition.
I'll quibble with one small thing. I firmly believe that keywords contain customer intent. There is no other reason for the modest success of Google. If you think you don't know what the customer intent is, say for a "generic" word like lenovo, then buy some paid search ads (on any search engine), create a landing page with a multivariate experiment and you'll know the intent in less than a week. Boom! Done.
I also believe that having access to Google's data provides deep insights for Website Owners who receive a good chunk of traffic from Google. For example I had 62,000 visits on the blog last month. around 22,000 were from organic search. 80% of those were from Google.
For me anything I learn from Insights from Search can easily and directly be applicable. I can also extrapolate that into what might be happening at yahoo and microsoft and ask (or use compete to get that!).
There are sites that get 2% of the traffic from Google. For them this data is probably just useful to understand macro trends.
You are also right that understanding how the data is collected and what it covers is critical. I have stressed that repeatedly in the last three posts. For Insights for Search please see the link included in the blog post (at the end).
Thanks so much for the feedback.
-Avinash.
Holger: I feel silly. That's what happens when you write posts late in the night! :)
Thanks so much for taking the time to share this. Really, really appreciate that.
Jim: Happy to help, whatever I can do to make your life easier is worth it! [Yes I know you probably think I am making it harder. :)]
Alice CS: I understand your perspective. But you are asking for too much.
Let's take this one thing at a time.
If you wanted access to data like this, say from companies I have named above or others, the price of entry is a quarter million dollars. And that data is not even as good as this data. So step one, you have data you did not have before. Use it. To the limits of its ability to share insights (and make no mistakes, it has its limits).
Even if Google wanted to answer some of your questions below it can't. No company can. You are asking for the impossible – from one source. If you recall my Web Analytics 2.0 and Multiplicity strategy then that will help answer some of these questions. But still not all.
Data that raises the right questions and removes the previous darkness where ignorance fueled questions is good data.
Yes still questions, but so much better than before. That is all there is to it, nothing more, nothing less.
[Let me hasten to add that there are other tools that answer some of the questions in your comment. You can do custom contract studies. They are expensive but well worth it. You should convince your boss to pay for them.]
Thanks.
-Avinash.
Very insightful post Avinash. I had used Insights for Search in the last couple of weeks but I did not think of using it for anything beyond SEO type uses.
Your guidance on using it to measure brand and rising searches geographic segmentations were things I had not immediately thought about.
What is great about this post, all your posts, is that you are not simply doing a feature review. You use actual real world examples and show how to use the data. Thanks for that.
Harvey.
PS: It is actually quite incredible that Google is providing this data for free. It would be great if Microsoft and Yahoo! also started to share this type of data. Hopefully they are listening.
I guess that what I can't understand is – what is the main difference between Google Trends and Google Insights for Search? I am a little stumped at what the difference is, and ultimately, why wouldn't/can't Google just make one tool since they are so similar?
Which should I be using to find out the best results for the search terms?
Nice post Avinash.
Google Insights for Search is indeed a pretty cool tool. The fact you can both look at category trends as well as define your own categories, by grouping keywords make it very flexible. In terms of hardcore analysis, there is still a lot to ask for, but for ad hoc queries and simple visualizations, this tool is perfect.
From a business perspective, I think this is great at showing consumer demand. While it's not reflective of 100% of the market, I feel with Google's volume the data is still pretty reflective in the US. We recently did some analysis looking at traditional media's impact on online business, and our results were much less than from a study we did with them in a previous period. The client previously told us that there was seasonality in their business, and looking at their category search volume over a couple of years, we indeed saw less queries (demand) in the current period vs. the previous period. We could also see the category's seasonal cycle and how the client trended vs their competition allowing us to better plan for future tests. So now we can go back to our client and tell them why their results were less than stellar.
Pretty cool for a free product.
As always you have a very unique way teaching, its a blessing (for you and for us).
I say that becuase at our Agency we had a pitch from our Google contact and it was hum drum. He just managed to read the slides and rattle features off – there was no story, there was connection to the business. Both of which you have accomplished so admirably.
You should teach Googlers how to do this right. :)
Thanks so much for teaching us a couple new tricks in this post.
Kelly: They are both different tools that solve for different things.
Trends for Websites (contains broad web usage data):
Learn how: Competitive Intelligence Analysis: Google Trends for Websites
Insights for Search (contains search keyword data on google.com only):
Learn how: Competitive Intelligence Analysis: Google Insights for Search
They could be all in one tool. There is little overlap at the moment, but maybe it can be all put into one at some point.
-Avinash.
Check your "summer dips" against your .edu traffic to see if it's all the students who don't have Internet access once they're on break.
I think Google Insights is a great tool! Thanks for the explanation Avinash! One question though….I did a search for "san antonio spurs" and surprisingly, Argentina had a much higher index value than the U.S. (Well, it's not all that surprising considering how much the people of Argentina love and follow Manu Ginobili). Is the index the relative number of searches for that term across all Google searches in the world, or just in that country? I'm kind of confused because then when you segment by city vs. region, San Antonio has an index of 100, while Buenos Aires is only 6. Could you please elaborate on this a little more?
Thanks!
Ryan
As always I come across new things on this blog. Google insights as presented and explained by Avinash is an eye popping gift for a marketing man in this vast array of 'keywords universe' and the choices we make from it… Wonderful.
Great tool but for some funny reason it does not cover my country (Serbia) although Google covers it with other tools like trends for web sites etc. Very sad :(
Although I am a tiny marketer in the grand scheme of things, and one that wears many hats, this series has been insightful and very helpful. Thanks!
Another great post. Google Insights for search have many direct applications whether for marketing strategy or SEO/SEA.
The only things that is not clear for me is the "rising" searches and the fact we don't know volume involved here. So how should it be interpreted?
Let me take an example (i will simplify a bit): I did a search for Toyota, Germany. On top of the rising search I found out "Celica" as one of the top rising search. Ok. But the "Celica" is a discontinued model so I guess it comes from current owners (or fans) looking for informations or whatever. Now maybe the volume of search related to "Celica" was – let's say 100 the month before and then it reach 300 the next month. So that +200% increase. Still it is a small amount of volume. While you could have another keyword – let's say "Toyota iQ" that (I'm inventing here) with 20,000 searches on previous month and 25,000 searches on the next one. That's only +25% increase but still much more interesting.
Maybe I'm over-simplifying this but I would like to have your opininon (and from other readers) on that features.
Cheers,
Michaël
Michaël, you are stressing an interesting point here. However, seems like Google will not provide absolute figures (understandable).
What you can do is use an other search as an reference. It is not the same as absolute figures but you can compare.
Here is, how it works: click on the search you are interested in and you get the development over time, add a reference search and you can compare e.g. "Toyota IQ" and "Toyota Celica", which is actually quite interesting.
http://www.google.com/insights/search/#cat=&q=toyota%20iq%2Ctoyota%20celica&geo=DE&date=&clp=&cmpt=q
UPDATE to my last post: Due to the normalization used by Google, compare 2 searches is not possible, sorry.
But then there is another Google tool that might help: https://adwords.google.com/select/TrafficEstimatorSandbox
Michael and Holger:
I think normalization is for regions. So as long as you compare for the same region (or all regions) i think you can use Holgar suggestion to compare searches in those important cases of high rise for not that many searches.
Hi Zvika,
unfortunately normalization is based on the search term.
So what does this mean? Let's assume that from the day that Google has this data, the highest peak for the search "toyota celica" was 10000 searches a week, then this would get a value of 100 (until one day a peak is higher than this). 5000 searches for "toyota celica" would mean 50 on these charts. At the same time the highest peak for "toyota IQ" could be 1000 (which equals again 100 in the Google charts).
So 50 searches or 5000 searches could always shown as 10 in the charts. It just depends on the highest peak for this search term.
http://www.google.com/support/insights//bin/answer.py?answer=87285
The only thing you can get out of this is, is the search rising or falling and how does it develop over time. If you would know one point on the line you could calculate the real figures for the whole period of measurement – but only for this particular search term. The google guys are clever… ;-)
Holgar:
I think that when you put two terms together the graph is normalized against the pick of the highest one. (the highest pick of the two)
example:
http://www.google.com/insights/search/#cat=&q=flights%2Canalytics&geo=&date=1%2F2008%2012m&clp=&cmpt=q
so you can compare the two.
I might be wrong but according to what you say there isn't really much we can do with this tool. I think that most of Avinash's insights in this post are based on that.
Maybe someone from google wants to help?
@Zvika: When I look at your example, you must be right. However, this is somehow contrary to what they write in their help. At lest they don't mention what happens if you have 2 terms.
Would be good if someone from Google could give us more information here. I will try to do some research on that.
Hi Avinash,
Excellent Trilogy about the Market interpretation Tools by Google. These excerscise is possible with Tools about of Google? Probably in USA yes, but in other countrys AD PLANNER is not effective at the momento.
I write about Occam´s Razor: http://www.filmica.com/audiencias/archivos/008256.html
Curiosity for you,
See you
Adrián
Holger, Zvika: I am afraid I think that Zvika is right in his explanation of what is happening. : )
Here is more context (and food from thought) directly from the proverbial horse's mouth:
> > > > > > > > > > > >
In order to understand the meaning of the numbers in the graph it's important to distinguish between 2 separate and important mechanisms:
1. Scaling [Check this link for more.]
2. Normalization [Check this link for more.]
Scaling is simply multiplying all the points in the graph (of all lines) by one constant, in such a way that the highest point in the graph is 100.
Normalization is a little trickier to understand: it means that the numbers represent proportions and not absolute volumes. Data is normalized with respect to the geography and to the time frame.
It might be easier to understand this by noting that the regional interest top counties may contain small countries.
Similarly, the time-series graph does not show the global internet growth, but only the specific search term growth.
This means, that you are able to compare two search terms in the same geography and the same time frame, since the graph is only normalized by the common constraints (geo and time).
> > > > > > > > > > > >
Hope this helps.
Avinash.
Google Insights for Search made an immediate impact in our daily work. That was an incredibly useful suggestion! Thanks so much!
Glad I came across your blog :)
Very good article! Good comments too… I found this article because I was trying to find out more about the difference between G trends and G Insights for Search. I had just posted on my Word Face-Off blog. Normally, I use G Trends only but 4 of my 5 search terms had zero data before 1-1-06, very odd. So I tried G Insights where they did have a complete data set. Does anybody have an explanation? I'm curious: is it just a different database of searches that is used?
I recently heard about google insights from Christopher Penn at a NEDMA conference in Waltham Massachusetts. Avinash's explanation of the tool's utility was just what I needed to gain a deeper understanding of its potential.
Keep in mind that as more people go online each day, it tends to put downward pressure on the graph…So even if a search term's volume stays the same (or even increase) the graph could still show a downward trend…
From Google Insights Help:
"Does a downward line indicate lower search volume?
No. A downward trending line doesn't necessarily mean that the absolute traffic for a search term is decreasing – only that its popularity is decreasing.
For example, let's suppose that Melbourne has 1000 internet users, and 500 of them (or 50% of internet users in Melbourne) searched for the term spring festival in April. In May, 500 more internet users moved to Melbourne, but none of them knew about the spring festival, so no one out of that group searched for that term. So even though there was a total of 1500 internet users in Melbourne, only 500 total (or 33% of the total number of internet users) searched for spring festival; although although the search volume for that term remained the same, its popularity actually decreased percentage-wise."
Ryan: Very sound advice!
That was the primary reason most of the graphs I had in the post used two lines and not one. With one line there is the challenge you mention, the denominator is bigger. But if you use two lines you are overcoming that a bit, if you compare two relevant terms.
So take the very first example. If you only typed in bryan eisenberg the line would go down, you would not know if that's good or bad. But if you compare bryan with avinash and garr, off the same denominator, you can easily know if things are good or bad.
Does this make sense?
Thanks.
-Avinash.
Yes, that makes sense, using multiple lines you can compare how you are doing relative to others. Nice post!
Thanks for comprehensive description.
There is one thing I don't understand about Insight for Search:
If I look for the term computers, I get an average of 44.
http://www.google.com/insights/search/#q=computers&cmpt=q
If I then look for the term mortgages, I get an average of 54.
http://www.google.com/insights/search/#q=mortgages&cmpt=q
However if I compare the two terms, it turns out "computers" is a lot more popular than "mortgages" (as could be expected).
http://www.google.com/insights/search/#q=computers%2Cmortgages&cmpt=q
Does this make any sense to anyone?
Marco: Ahh.. it is a little tricky.
The first thing to understand is that the data you see is that the number you see is not absolute, it is normalized and presented on a scale from 0-100.
Here are details about that: http://www.google.com/support/insights//bin/answer.py?hl=en-US&answer=87285
It says: "The numbers on the graph reflect how many searches have been done for a particular term, relative to the total number of searches done on Google over time."
The second thing to understand is how the scaling part of the data works. Here is context about that: http://www.google.com/support/insights//bin/bin/answer.py?answer=87282
Here is the relevant part:
"To arrive at those values, we first normalize the data. After normalization, we divide each point on the graph by the highest value and then multiply by 100. Different plots are not comparable unless they share the same original highest value before scaling.
For example, let's suppose that interest for the term skiing surged in the month of November in Sweden. Our system designates that peak as 100. Now let's suppose that interest decreased significantly in December, where the next highest peak was approximately half of what it was in November. That peak would then be designated as 50, and so on."
You can now see how it is possible to see the Computers / Mortgage graphs that you posted (depends on the peak of each set of searches and the relative decline/rise subsequently in case of individual graphs).
Avinash.
Great article but you totally misrepresented what Google Insights for Search does with the bar charts it creates below the trend charts for the search results. The country rank it shows is not based on real search numbers. It is based on relative interest for that search term in that country and the rank can be VERY misleading, which I have often seen.
If you do the hard work of cross-referencing those bar chart rank results with the Google Keyword tool that gives actual average search numbers per country for the last 12 months, you will find that it almost never matches the results from the Google Insights for Search Charts bar charts.