 We are all blessed with more data than we know what to do with, and all for the price of a few lines of JavaScript added to your website. In this type of an environment, I've frequently stressed the value of identifying targets for your key performance indicators.
[See step four in the process for creating your Digital Marketing and Measurement Model.]
If you have set the targets for your KPIs up front (Unique Visitors for Sept. should be 1,356,000), you've set a clear line in the sand as to what performance will be declared a success or a failure at the end of the measurement time period. In turn, that will help you figure out where and how much to dig to understand performance.
Make sure you don't have anything on your strategic dashboards that does not have a pre-identified target.
Let me admit right away that setting targets is a complex art and science. Yes, and I've said this frequently, if all else fails just set your target for a 10% improvement. Anything, absolutely anything, can be improved by 10% with just a small amount of effort. But, you likely want to do something more complicated, and more sound, over time.
One of the key elements in the process of setting targets for your own performance it to collect benchmarks from others (competitors, industry-level, etc.) related to their performance. And, if you've met any boss, at any company, in any country, then you'll never go a few days without them asking for benchmarks (turns out they are also very interested in knowing if the performance they are seeing is good or bad).
So, in this post let's look at the options at our disposal in getting benchmarks we can use to set targets. I'm planning to cover the four different strategies at your disposal to collect benchmarks. Yes, four!
1. Own data benchmarks
2. Industry analyst data benchmarks
3. Competitor data benchmarks
4. Vendor data benchmarks
In each case you'll learn how to use each source, the pros and cons of each, and by the end of this post you'll never have an excuse not to have rock solid (or, ok, just a tiny bit squishy) targets for your company's digital performance.
1. Own data benchmarks.
There is a tendency to believe that if we need benchmarks we need to go outside. Yes, there are benchmarks outside, we will cover them in this post. But it is often a million times simpler to create your first set of benchmarks using your own data/performance. If you've read my first book Web Analytics: An Hour A Day, you know that I've advocated this strategy since 2008! See Page 269. :)
This recommendation also valuable for companies that have very unique business models, or face other unusual circumstances (geographic, size, amount of innovation, and many others).
So how can you use your own data?
Here's a simple trend that shows visits to your website, in this case for one year through September…
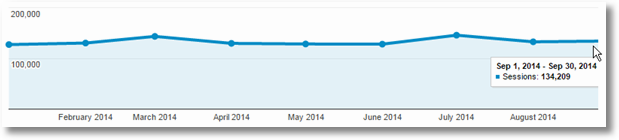
You now want to create a target for the number of visits (/sessions) to your site through the end of the year, a simple goal.
The most straightforward thing to do is to look at the trend for last year, and look for insights. Here's the complete year 2013…
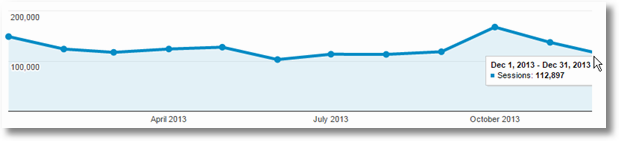
While the numbers for individual month are different, you can see that October spiked and then things came down to below Sept performance by December.
There, some primitive benchmarking information you can use. Export the data into Excel, look at month over month trends for each year, look at month over month trends across years, and you have a fat set of numbers that can serve as benchmarks…
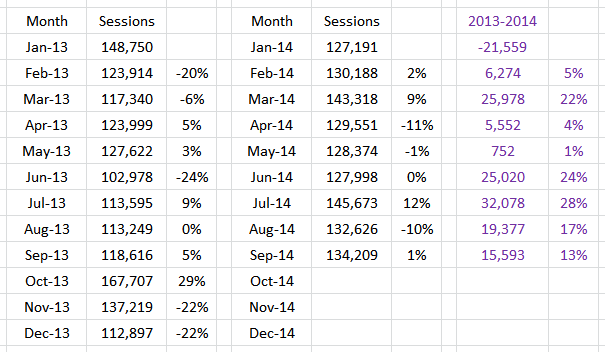
Exactly which cell's you'll end up using to lay out expectations for Oct, Nov, and Dec 2014 will depend on a number of factors and your insider knowledge and your forecasting savvy. But remember, even if you just say I expect this year to be roughly like last year, you are not going to go terribly wrong if company is not running a terrible business. If you don't stink completely, things on the the web always go up and to the right over time – the argument is simply about the slope of the line and short term fluctuations.
If you want to learn about how to do simple forecasting and trend analysis, please see the official forecast function in Excel post on the Microsoft website, and this handy tutorial on trend lines and forecasting in excel.
In an ideal world as you do the above exercise, you'll take into account:
1. Any big changes in your marketing/customer acquisition strategy over the last time period (more money doing Search, less money in Email, elimination Facebook as it does not work, etc., etc.).
2. Any big shifts in investment (marketing, customer experience, team sizes, tools).
3. Outcomes of the conversations with your Finance team and Sr. Leaders (company is leaving China, our IPO is next week, 1,800 new stores are being opened in 180 days, our new IRR is 8%).
And other such things. They will give you context you need to add to the numbers above to ensure the art part is also taken care of when you do the science part.
My advice to you above is perhaps a bit primitive. But, please be assured that you'll be surprised how much value it will bring as you get going on this journey. Give it a fair shot, before you go on a long quest to find the best benchmarks in Babylon.
Couple of other examples of going to your own data to identify your benchmarks.
Conversion rate is one of those metrics that I strongly encourage you only create benchmarks for from your own data. None of the four other methods are advisable. Even if they give you conversion rate benchmarks.
There are four reasons, again from Web Analytics: An Hour A Day, from 2008 (!):
1. Clean measures of conversion rates require a clean and standard implementation of the ecommerce tags. This has never been true – not even for people who use the same analytics tool.
2. Conversion rates reported by asking a group of companies what they are for their company, are hugely suspect.
3. Competitive intelligence tools have a very poor capabilities to measure conversion rate accurately.
4. Even exactly similar companies (think KMart – Wal-Mart, Expedia – Orbitz, American Express Credit Cards – Chase Credit Cards, Red Cross – ALS Association) have a profoundly different digital strategy. So the fact that Expedia has 5% conversion rate and Orbitz has 102% is like comparing apples and monkeys. Don't do it.
Hence, if outside providers give you Conversion Rate Benchmarks, avoid them like you would avoid cocaine. Addictive, not good for your health and will lead you astray.
But, you have your own data! Use that because you know your strategy and your implementation.
Look at the overall conversion rate over a long period of time (a couple of years minimum if you can)…
And you can go through the exercise above to come up with your benchmarks.
In the case of Conversion Rates, I would encourage you to create benchmarks for the overall conversion rate, rather set it for your most important acquisition strategies. In my case I'm looking at Social Media (boss LOVES social!), Direct Traffic (I get a lot of it!) and Organic Search Traffic (can't ever have enough of that!)…
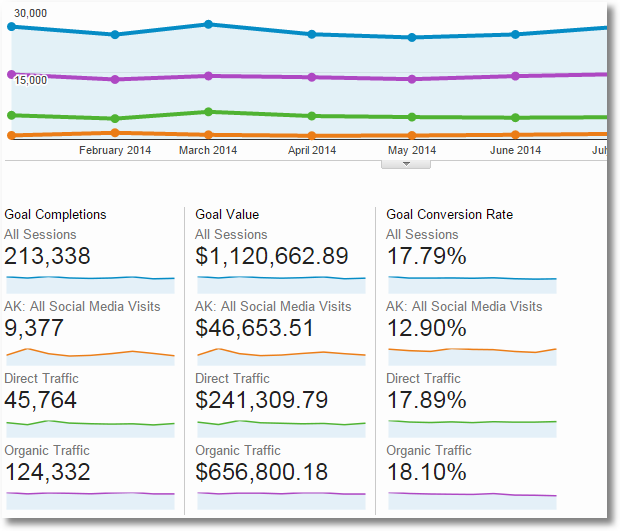
You can see the wisdom of not just setting a 20% aggregate conversion rate, based on the above benchmarking data. For Social you'll fail miserably (the hill is too high to climb!) and the target for Organic Traffic might be be too low!
Another reason to identify separate ones for each of your major marketing strategy is that this will also provide you very specific and clean guidance when you do advanced segmentation to understand performance. What's good an what's bad will jump out at your significantly faster.
As you can see above you can leverage benchmarking even if you are not an ecommerce website (above data is for non-ecommerce site), or indeed you have any type of business.
A couple more tips on benchmarking using your own web analytics data, this time the performance of your content on your site – mobile or desktop, site or app.
One of the easiest ways to improve outcomes on your website, it is great to make sure that people don't say this via your bounce rate metric: I came, I puked, I left.
Get the big trend over a large period of time for a specific page. This graph is for the home page of a website…
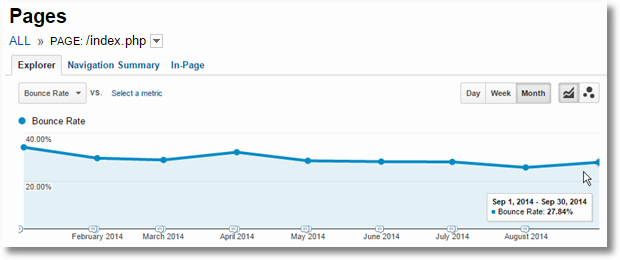
You can use the above data for benchmarking, following a strategy similar to the one described above. (On that note a question that might have jumped out at you is why is the Sept. bounce rate going up, when for the entire last 12 months, the rates have going down steadily!)
Since this is such an important page (home pages, FTW!), we will follow the strategy we've learned from conversion rate analysis: segment the data by your most important segments coming to your home page.
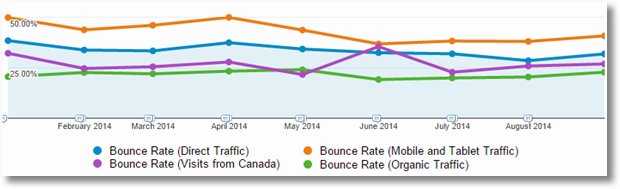
For my business Direct Visits are very important, a much higher % of people see the home page of the site, as are mobile and tablet combined have a very desirable audience. I also love Canada because of the traffic, and I want to know if I can expect high conversions. And who does not love Organic?
The above graph shows you the dangers of setting targets on aggregated benchmarking analysis. The best way is to segment these metrics and then set individual targets for your most important segments.
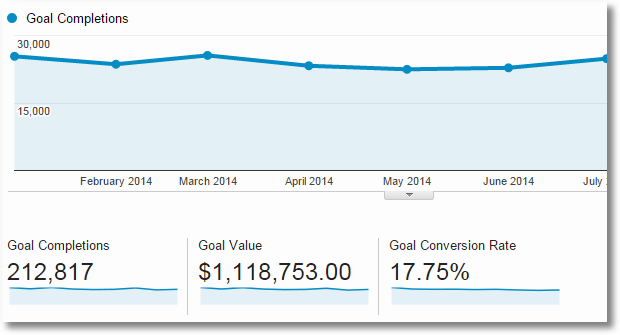
One more metric I love and adore highlighting to the senior leaders in companies is the KPI Page Value in Google Analytics. I can't think of a better way to identify which content we create (pages, videos, interactive quizzes, comparison charts, op ed articles, flash magic thingies) is adding the most value…
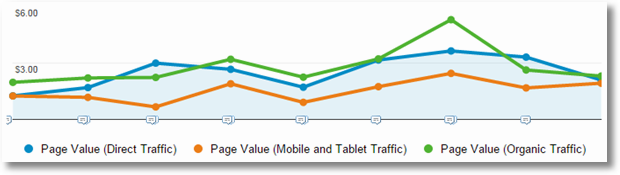
Again, same strategy. Get to pages/content you've invest the most money in, identify the segments that will high a light on your victor or failure.
Finally, one small bonus, if you are amongst the absolutely most sophisticated Analysts/Marketers in the world, you'll create desired targets for your Assisted Conversion performance…
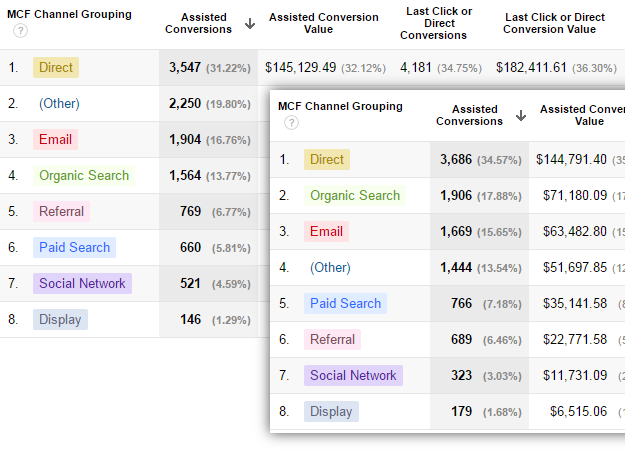
Most companies continue to use the awful last-click attribution model (see more: Multi-Channel Attribution Modeling: The Good, Bad and Ugly Models). Focusing on Assisted Conversions, will first help your company move away from last-click but in the long run empower your teams to solve for getting an immediate conversion, but also valuing the longer-conversion cycle.
I hope you are convinced that our first source to benchmark ourselves, because it is within reach and you can teach the entire company a new habit pretty quickly.
2. Industry Analyst Data Benchmarks.
The place where we traditionally turned for benchmarks were industry analysts, associations, groups of people talking to top people at companies. This would include lovely organizations like Gartner or Forrester, Consumer Electronics Association, eMarketer/eAnythingelse, lone cowboys and cowgirls sending out surveys seeking input on various questions (in our case including "What is the current conversion rate for your website?").
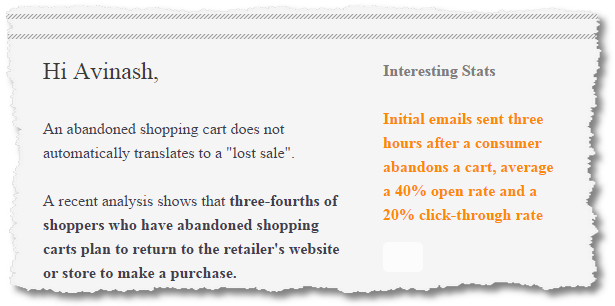
The result would be a note you might get whetting your appetite like this one… usually offering you a full report in exchange for a reasonable amount of your funds or signing up for consulting services or purchasing software of one kind or other other…
In the past when we had little choice such reports, collections of benchmarks, held an incredible amount of value and sway in the industry. We have a lot more access to a lot more information, including our industries and performance. Hence, over time, though the costs were reasonable, I've become shy about these resources as a source of value/quality.
The sources providing this information continue to be insightful in many services they offer, and you should definitely hire them if you need those services. Just skip the we can give you data and benchmarks on performance bits.
If you do use them, please consider the data collection methodology.
A common source of such benchmarks (be it digital marketing or SEO or Landing Pages or anything really) is extensive surveys an organization might send out to a hand selected group or tweeted to the masses via social media. This creates a sample, sampling and self-reported biases.
Please make not mistake, the organizations producing this data do a lot of math work, they apply great models, the amount of effort is wonderful. But, input influences output more than the processing of the input. So, be aware of those three biases, and do your best to accommodate for them if you do use this data for anything.
Sometimes the data you see is omg so tempting (!), dig deeper into the source of the data, the methodology used to collect the data and the assumptions that were applied when processing it and the limitations that are mentioned in small font size in footnotes.

Net, net. These were more important in the past. You have too many other more valuable alternatives today. Exhaust those first.
3. Competitor Data Benchmarks.
After exhausting the value of strategy one, own data benchmarks, my next go to place is industry and individual company/website performance data collected by competitive intelligence vendors.
CI vendors have lots of interesting ways in which they collect data. (The Definitive Guide To (8) Competitive Intelligence Data Sources!) The processing is very apples to apples for any site (or if you prefer, rotten apples to rotten apples). They have extremely large datasets to play with, or provide to use for analyzing performance.
The only caveat to internalize is that the larger the size of your website, or your competitor's, the better the data you'll see in CI tools. For any site that receives less then 50k Unique Visitors a month, you are looking just looking at noise, any resemblance in numbers to reality is purely coincidental. Above 100k Unique Visitors a month, you are looking at good noise, kind of useful data, use it with just a little caution. Above a few hundred thousand UV per month, things start to get really interesting.
If your direct competitor, or you, have under 100k Unique Visitors, look at overall industry level data or a competitor that is much bigger than that. You can still learn from both.
With that, let's look at the first rich source of benchmarking data in CI tools, the industry and sub-vertical reports.
This is a report for Beauty and Fitness industry websites in the UK from the paid version of SimilarWeb (how they collect data pdf)…. and notice it includes the confidence building number – how many sites they have in the dataset…
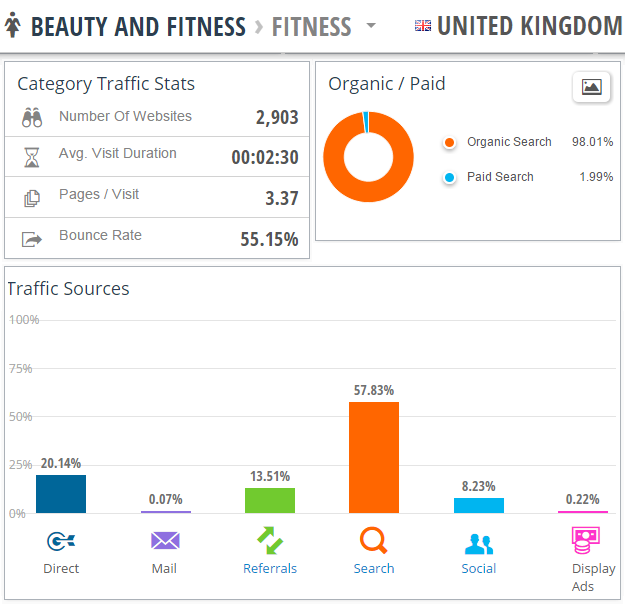
If you are the Marketer/Analyst for Virginactive.co.uk or Weightwatchers.co.uk or Stylist.co.uk, you have very good context frame your own performance. You have the standard metrics like Time on Site, Pages/Visit and Bounce Rate. And you also have, perhaps more useful, the industry wide acquisition strategy distribution.
Now you can ask yourself the question, how come we only get 12% search traffic and 70% display ad traffic? That could be the secret to your rousing success! But even then, I think it gives you context for the opportunity you are leaving on the table.
So three valuable metrics, and two distributions ppc/organic (though I have to admit this is weakest element in SimilarWeb) and traffic sources.
Since SimilarWeb has international data, you can run these reports for any country and for extremely specific or broad industries and sub-verticals.
As an example, here's the report for the Real Estate sub-vertical in Canada, the same set of actual performance that we can use to create our benchmarks…
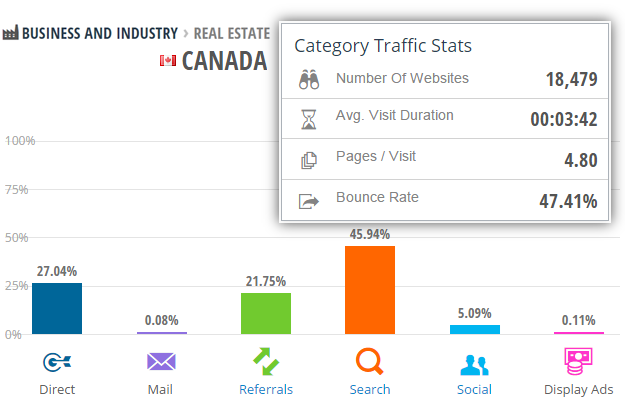
My favorite strategy for creating benchmarks is to take the above actual performance as layer one of context I need, and then I look for my big competitors as layer two.
For example, I've been working hard to crush Remax in Quebec. I want to crush, crush, crush them, and take over their business!
So after downloading the above data, I can also type in their URL into SimilarWeb and get their individual performance report (the link takes you to a free report, the one below is for six months from the Pro version).
I get the standard three metrics, and a trend for Monthly Visits. It delights me that my crushing seems to be working, their trend is down!
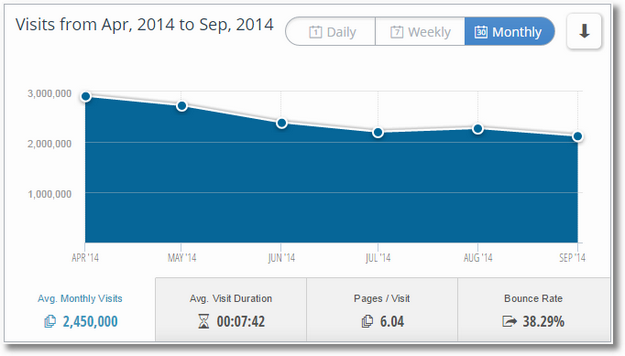
Ok, so my Quebec real-estate website is just getting 500k visits a month so it is unlikely that I'm causing the above. :)
Additionally, I also get the all important distribution of traffic to help me get context for my acquisition strategy/benchmarks.
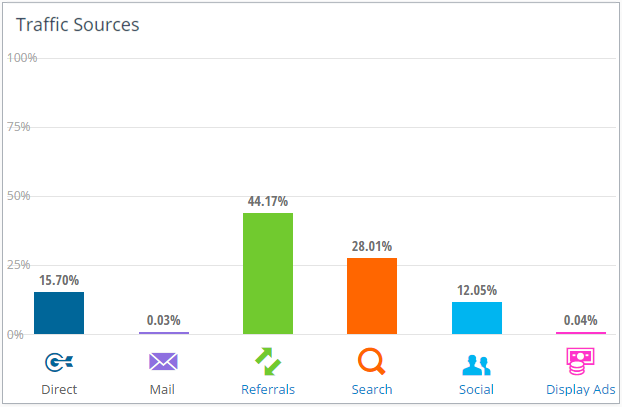
There is a lot more information available to me (psychographic, geographic distribution, keywords, referring sites, and on and on). But I'll only look at that information when formulating how to meet or exceed the benchmarks I've created for my company.
For the benchmarks, I just need the highest level of info that you see above.
Use the data in the industry report and the individual reports of a few competitors (not just one!) to create benchmarks based on observed performance (rather than self-reported survey performance as in strategy two).
You'll be amazed at how much more focused your digital execution is.
Compete is another source of competitive intelligence data that you can use for the exact same purposes. (How they collect data.)
The limitation of Compete is that it only has data sourced from US audiences (so if you type in www.vodafone.co.uk, you are seeing the data only from American visitors).
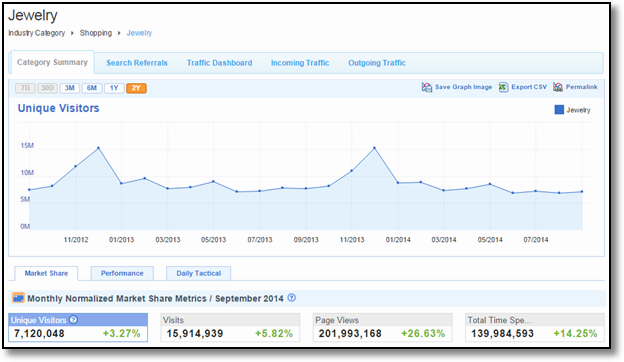
I can run industry specific reports (Pro version) that will share the overall Unique Visitor trend for the industry (gives you a sense for the overall size of the pie – excellent context), along with the four key metrics (though not bounce rate, that's ok)… like this one for the Jewelry industry…
In the industry view you can click on the Traffic Dashboard tab, to get the traffic sources presented as one of my favorite visualizations, the treemap…

You can click on any one of the the cluster's you are interested in, say, Miscellaneous, and drill down into the source that form that bucket….
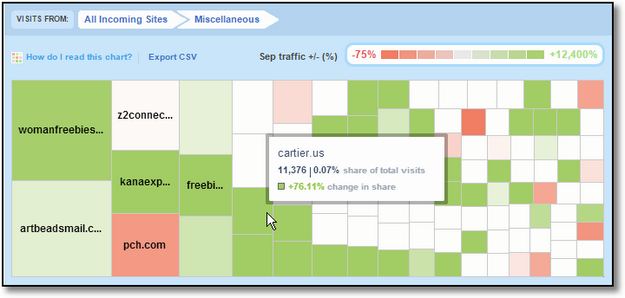
You get extremely detailed data. You will likely use the above level of detail in your execution strategy, it is nice that it is right there waiting for you.
As mentioned above, I'll use the above information as layer one of context. I'll focus on my big competitors and their specific performance for layer two of context.
Here's that report for bluenile.com, helzberg.com and kay.com….
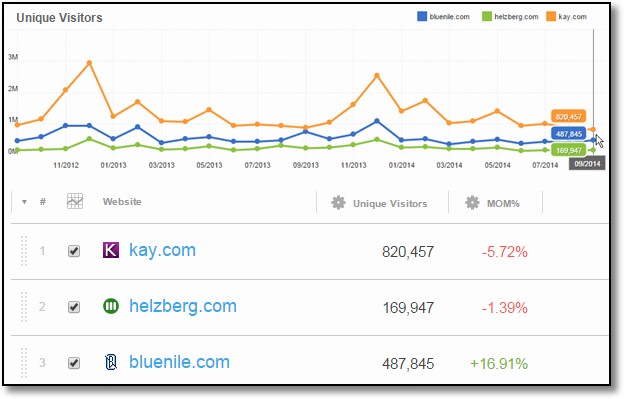
Clearly Kay is killing it. It is pretty interesting that while bluenile kissed kay in Sept 2013, it never comes close to Kay, who is pulling way in 2014. (Nice set of benchmarks for people at bluenile to shoot for, no?)
For my search benchmarks (total, just organic or just paid), I can drill down into search referrals report.
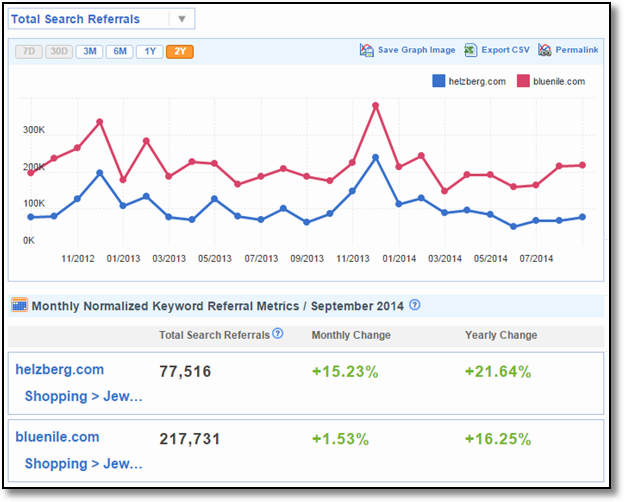
Lots of good data. Lots of good benchmarks. From observed performance and not self-reported performance based on a survey or via other such methods.
There is a lot more you can clearly do with competitive intelligence data, it will help you focus in on strategies you need to execute to meet the new benchmarks you've set for yourself. Use it for that as well!
(In case you skipped ahead to this part of the post, please try not to get or use Conversion Rate numbers you might get from CI sources. Scroll back to the own data benchmarks section and see the four reasons for why not. Thank you.)
4. Vendor Data Benchmarks.
Perhaps my favorite source of data for benchmarks, data from our web analytics vendors!
It is better than the observed data from CI vendors because this data comes from the same tags as you are using on your own website from the vendor you use. And rather than someone observing it from the outside, CI tools again, you have volunteered to share this data with other users of the tool. Hence it is the best possible source of data.
You are in the data, and your competitors are if they are using it too! As close to apple to apple as you can get.
So log into your lovely digital analytics tool and if you see this, rejoice!
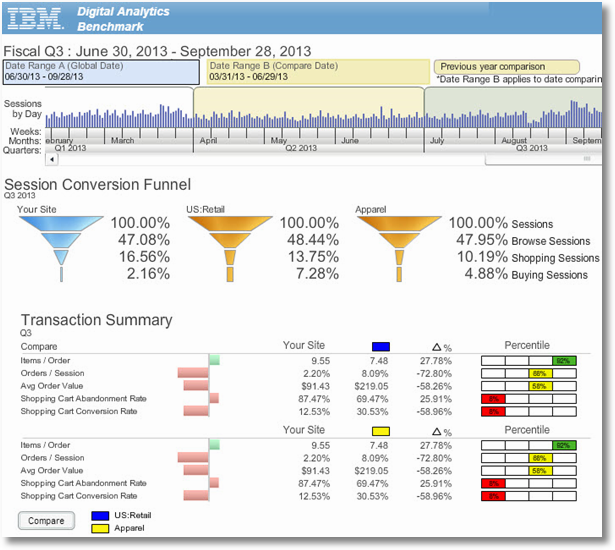
With the lovely IBM tool you can get abandonment rate and conversion rate (see caveat above) type metrics. You can also get session metrics and other behavior metrics. There are other things like browser types etc. which might be useful to our IT friends only.
Use the data to create your own benchmarks.
Benchmarks are not only available from web analytics vendors, any one who is the primary source of data collection can provide them. Some of these include MailChimp, for Email Marketing Benchmarks, and iPerceptions, for Customer Satisfaction Benchmarks.
I am also quite fond of the newly revamped v2.0 of the benchmarking reports in Google Analytics. The team has learned lots of valuable lessons from v1.0 and have come back with a bang with data that is even more insightful.
You'll currently find the reports in the Audience folder and the Benchmarking sub-folder.
Clicking on Channels shows you the first report.
Google Analytics will auto-detect the type of website you are based on an advanced algorithm that analyzes content and business type. In this case it, rightly detects that my site is a shopping website.
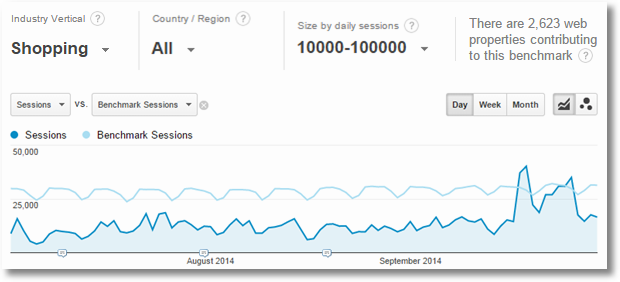
The second thing it does is create a benchmark for you based on its understanding of your size, and only compares you to websites that are similarly sized. You can see that I'm around 25k – 50k Visits a month, it compares me to other sites, 2,623 other sites to be specific, that are in the 10,000 – 100,000 daily visits range.
As in the case of SimilarWeb above, I love knowing how many other websites are contributing to the benchmark. Very confidence building.
For this blog, Benchmarking classifies me into Internet & Telecom vertical. I can see that I'm totally crushing it (again after crushing remax! :)).

Until I notice that the benchmark daily session size GA has chosen for me is 1,000 – 5,000 daily visits. I switch to the next level up. I'm not crushing as much. Boo! But no worries, what does not kill you makes you stronger. Watch out 100,000 daily visits people, I'm coming after you!
Google Analytics allows you to change your industry vertical by clicking on the first box. There are 1,600 different verticals, sub-verticals, sub-sub-verticals and sub-sub-sub verticals included. You can get pretty darn specific in terms of getting benchmarking data now.

As you can see above, you can also limit the data to a specific country. Guyana, anyone?
And you can choose from the seven traffic size categories (with the one GA has chosen for you by default clearly labeled).
Unlike the competitive intelligence tools, you can be pretty small and Google Analytics will still give you benchmarking data. Sweet.
Here's how the power of leveraging various controls works… Here's my ecommerce website as I see when I look at the standard benchmarking report…

I've made a major push in my acquisition strategy in the United Kingdom, so I can switch Geo to the UK and after a few seconds of waiting with a bated breath, I get my current performance benchmarked….

Not as cute as I would like it to be. But, I now know where I stand, and where I need to get to for other sites in my industry vertical who also get traffic from the UK. Given something magical we did in mid-Sept (remember that is your real actual data), I need to repeat that or learn lessons and hustle.
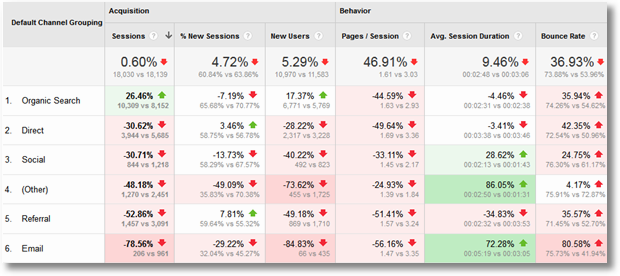
But traffic is not the only thing you get in the new, improved and better smelling Google Analytics benchmarking reports. You also get lovely stuff in a super cute heatmappy table!

Remember how enamored I was with strategy three of CI tools with traffic sources to improve acquisition/marketing/advertising? Boom! You have it here, with actual self-reported data.
The Default Channel Grouping the same as in your Acquisition > Channels report. You get two six metrics: Sessions (visits), New Sessions, New Users, Pages/Session, Average Session Duration (time on site), and Bounce Rate.
You get your overall performance against the benchmark in the first row of data (gray boxes), and then individual segmented performance.
The cool part about having this built into your analytics tool (GA or IBM or whatever enterprise tool you are using) is that all the computations are done for you already. Look at the green, white and red cell colors to focus on certain zones and get a sense for your performance.
(In case you are curious, like I was, as to why the arrows are there, they are there for our color blind peers. Clever addition.)
We are doing better at Search and Social, getting lots of new visitors, but at a much higher bounce rate and lower site engagement. So we are better at acquiring irrelevant traffic. Oops!
Without the benchmark, you would not know. At least now you know, even if you are crying. Remember, you are just the analyst. Someone else is going to pay for this. :)
There are two buttons at the top left of the table in your benchmarking reports. The first button is pretty nice, it gives you the precise numbers. For example, showing me that I had 243,985 visits vs. the benchmark of 100,725 visits.

I find this to be distracting, the report has too many numbers by default and it looks like one big data puke. Hence I take advantage of that first button and turn the numbers off.
The second button, next to my mouse cursor above, turns off the heat-map on and off. When it is pressed off you get a nice clean table with just the arrows.
When you choose to geographically focus your benchmarks, you also the detailed data along with the overall session performance.
For the above website, I've chosen to zero in on Canada and you see all my numbers, and indexed performance, changes dynamically…
If I choose to obsess about my Canadian strategy (and I do obsess about it!), I can do so with a unique set of benchmarks to inform targets I'm going to shoot for in my Digital Marketing and Measurement Model.
Channels is the first benchmarking report in Google Analytics. The second report is Location. It shows my performance segmented by countries. The same six metrics (I've excerpted only four below for the sake of image clarity). The same feature-set (including the ability to drill-down by industry vertical, size, etc.).
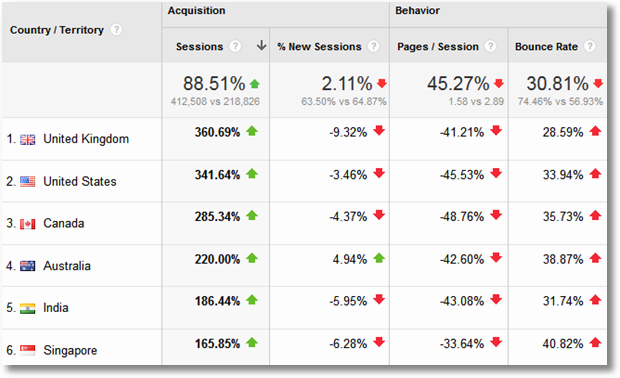
The above is my standard view of the benchmarking report. I've turned off the precise numbers comparison and the heat-map (though I love the latter, I think the arrows suffice).
The third and final benchmarking report in Google Analytics won't surprise you. Given all the, deserved, hoopla around mobile, the third report shows device benchmarking information.
And…. I'm getting crushed. Really crushed!
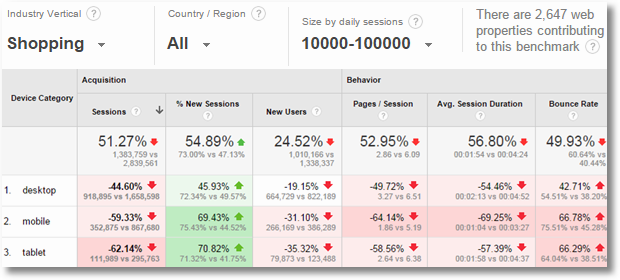
Just look at all that red. Blood everywhere. Sure, of the low number of visits I have, many are new sessions, but how is that any solace.
Particularly crushing is the mobile battle. By end of Dec 2014, for most major websites mobile traffic will be greater than desktop permanently. So the fact that I'm -59% and -62% respectively for mobile and tablet should light a fire under our collective rear-ends at the company.
And yes, sometimes we all know that mobile is important. It takes this type of very specific mobile data for the message to be heard.
In order to make it more meaningful, and hoping less painful, I drill-down to the Women's Clothing industry vertical (my website's niche).
Sadly…
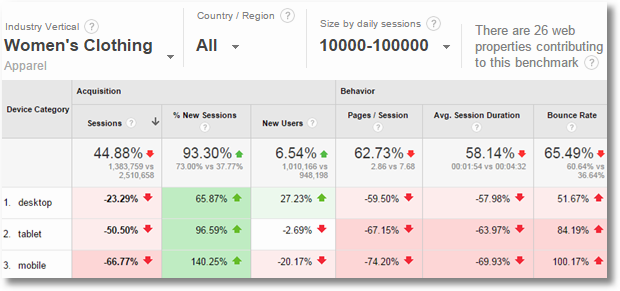
Our benchmarked performance on mobile becomes worse, tablets a little better, and we stink a lot less at desktop (-23% to -44%). So some benefit from being able to be specific about the benchmarks.
Finally, just to bring this whole thing home properly… I focus on the country of Iceland because… well, why not… and in a few seconds I have my report….

We are crushing it in Iceland! All three people. : ) Ok, not three, 1,353, but crushing is crushing.
I hope you see the power of having access to this data, and being able to focus very quickly on how we are doing as a company on the web. I hope you see, regardless of which strategy you use (one, two, three or four), that you can make your dashboards that much more meaningful, get your leaders and your peers to take action faster, and be smarter about getting relevant customers to engage with you and by delivering relevance and satisfaction, create higher business profits.
Benchmarks help create meaningful targets. Meaningful targets help with clearer understand of success, or failure. And that… is awesome.
Go, win smarter!
As always, it is your turn now.
Does your analytics practice include setting targets for your critical few KPIs? If you use benchmarks, which of the four strategies do you currently leverage? Which one has given you the most trouble? Of the strategies outlined above, which one do you dis-trust the most / find least valuable? Which one is your favorite? If you were to give advice to your web analytics vendor, which metric would you love benchmarking data for next?
Would you please share your guidance, advice, kudos, critique and life lessons via comments below?
Thank you.


 Via
Via 


Thanks for another great post, Avinash.
I've always been fascinated by benchmarking at the industry-level for higher education, because in this niche, it's the key to raising awareness and helping analysts start the conversation with their bosses.
So, when I saw the new Google Analytics benchmarking reports, I played a bit with it to get an idea of how we were doing and came up with the following report:
http://higheredexperts.com/edu/2014/09/30/the-highered-benchmarking-web-analytics-report-aug-2014-research/
I was surprised to see the sample size of each data buckets for the US colleges & universities – about the same number of websites in every bucket. I was wondering if you know if GA use all the accounts signed up to share benchmarking data or only a sample?
Karine: Very nice post, thank you for sharing it with us.
The Google Analytics benchmarkting report uses the data from websites were site owners have opted to share their data anonymously. There is a little bit more about that (and how to opt in/out from sharing) here: Google Analytics Data sharing settings.
I'm sure that other vendors who also have benchmarking data have different approaches, please check their sites for more.
All the best!
Avinash.
Thanks, Avinash.
Wonderfully written article with lots of practical tips!
I found the balance between business advice and data analysis to be refreshing. Great job!
How did you get the percentage values given for the year 2013 (first excel sheet, column 3 in this page)?
It does not seems to be the calculation for the percentage increase values. The calculation for the 2014 is percentage increase calculation, but not 2013 calculation.
Dint: Sorry for any confusion.
The first percentage is for 2013 and the change vs. prior month, the second percentage is the change for 2014 and the change vs. prior month, and the final percentage is the change for the same month vs. prior year. Same formula.
Avinash.
Hi Avinash,
These benchmark performance reports are simply amazing. Before this report we received so many questions relating to how a client is faring compared to the industry that they are in. Until now, we could not do that. This report allows us to do that. I have one question regarding the relevancy of it –
Because of the reporting being relatively new and you have to give permission to share the data anonymously, not everybody will be part of this process. I sit in a country where analytics is not top of mind and not everybody is opting in for such a service. When I select my country within the benchmark report, it shows that there are no other data to compare. Which means that nobody within the industry, within the country has opted in for this, which makes it a bit irrelevant.
I can compare it to other countries, but then it makes the data a bit irrelevant.
Tiaan: The higher order bit is that you are just trying to get broad context to your performance. Nothing more, nothing less.
I love that the Analytics team has added a lot more transparency about what type of websites are being included in your benchmark, and how many sites are included. Between that, for your country, you have information that helps build confidence in the data.
Please also note that there is a threshold built into GA. If there aren't xx websites sharing data, you won't see any data. If you see data, it has passed some basic filters.
For your specific combo (industry and size of website) if there is no data, it is ok to get some general guidance from worldwide data, but it, as you say, is just very broad guidance.
Avinash.
Strategies are a lot of help.
I somehow understood benchmark matters which I've been thinking of ever since. I've been browsing pages too and learned a lot about internet things. Very useful indeed. These data analysis is so clear and detailed.
Hi Avinash
Good post.
Have a query here. How much impact do you think sampling would have on the accuracy of benchmarking reports?
I ask this questions since my site lies in 10,000 – 100,000 sessions a days and my competitors lie in 100,000+ sessions a day category. Would these benchmarking reports present a fair picture?
Ankit: There is no sampling involved in computing the metrics you see in the bench-marking reports.
This is also especially true because when you look at the standard reports in Google Analytics, you are seeing unsampled reports. Sampling kicks in for our custom reports and advanced segments etc. I'm not saying this is 100% always true, but I was just looking over a site I analyse that gets more than a billion hits a month, there is no sampling.
To your second question… You are asking if your comparison for your 10k website is still useful if your competitors are getting 100k visits. Please see my note to Tiaan. And you can treat your benchmarks provided as numbers to shoot for as your company evolves.
-Avinash.
Avinash. Once again, thanks for the thorough insight of benchmarks. I'll be spending more time on the benchmarking reports in Google Analytics.
As usual, I will be using this for reference. You're awesome.
Avinash,
Great post!!
You should definitely add this as a section in Market Motive web analytics class.
Nate: Will definitely do that!
The instructional videos on http://www.marketmotive.com usually have much more in-depth guidance, and more tips from the front-lines, so you can rest assured that it will be even better there!
Avinash.
Avinash,
I checked out the competitive analysis tool SimilarWeb. How are they able to report the (not provided) keywords? and is it accurate?
Nate: Competitive intelligence tools have many ways to collect data.
Some are more intrusive than others. In some of the methods, there is a way for them to collect data that you might not get via the search engine's referral link.
As to how a specific tool gets it and how "accurate" it is, please reach out to them.
(Accurate has quotes around it simply as there is no such thing as accuracy, this time without quotes, in all CI tools. It is simply "accuracy." The data is still valuable, and smart analysts, via experience and practice, figure out how to use it for optimal purposes.)
-Avinash.
PS: Two posts of value with more information on this topic:
~ Search: Not Provided: What Remains, Keyword Data Options, the Future
~ The Definitive Guide To (8) Competitive Intelligence Data Sources!
Reading your points gave me a lot of ideas, I'm going to use the benchmarking reports (from GA and the CI tools) to monitor my site's performance.
Thanks Avinash.
Hey Avinash,
Thanks for Great sharing!!!
I think it help me because few weeks ago I start to create my own blog! Thanks again.
Thanks for another outstanding and insightful post, Avinash.
Very written article with lots of practical tips! I use Competitive intelligence tools like : Similarweb and SEMRush.
Another gold mine of information.
I liked how you mentioned that comparing vastly different digital strategies (re: "So the fact that Expedia has 5% conversion rate and Orbitz has 102% is like comparing apples and monkeys. Don't do it.") is absurd and shouldn't be done.
Great post!
Great post!
Thanks for sharing!
I've always been fascinated with benchmarking and now thanks to you I know more about it.
Very interesting post, Avinash. Always look forward to new posts.
Thank you.
Hi Avinash,
These vs features are great but is it possible to access the pure benchmark data to run regressions and find trends in the market?
Possibly answering questions such as : Benchmark sessions ( my peer group ) vs benchmark sessions of xyz
Removing yourself from the equation and understanding which categories are attracting the public.
Thanks
Ben
Benjamin: I'm sure the tool provider (any of the ones we mention in the post) likely consider the raw data to be proprietary in some way. My hypothesis is that they would not make the raw data available.
Please do provide your feedback to the tool of choice, I'm confident they would love to hear how you would make their analysis of the data better. They might even implement it!
Avinash.
Very nice post, Informative and helpful.
Thanks for sharing it with us!
As usual, great article, and very in depth. Thanks.
Wow, this is incredibly detailed and helpful!
I'm going to start setting some new benchmarks for myself in Google Analytics.
Thanks for putting the time into this post.
Hello, I was part of the Cars.com Summit you spoke at a few weeks ago and I was very interested in all of your insights! Brilliant!
As a sales rep for the dealerships in Michigan, I have access to all of our dealers google analytics. You showed us how to do the benchmark reports and when I did, I was surprised to see the decrease in mobile performance.
Can you give me some additional insight as to why the numbers are dropping when we are focusing all of our campaigns on mobile now? Is that number in comparison to other similar websites? Is this a direct result to the over flooding of mobile usage by the consumers? What can we do to improve the performance in mobile?
Thank you for your insights!
Lisa: My sincerest apologies for the delay in replying to you. For some reason your comment ended up in Spam, and I don't check it often enough.
I'm assuming you are looking at the Devices report in the Benchmarking folder, and the number, where you see a drop, is in the row called Mobile and the metric is Sessions.
That particular cell, is showing you how much traffic you get from Mobile vs. the competitive set that is included in the benchmark. So, for example, for me at the moment it is saying -43%, and that I received 125k visits vs. 219k of my competitor.
This indicates to me that my peer set in the benchmark is getting *a lot* more traffic via mobile than me, and I need to go address that because in my industry mobile traffic is growing much faster.
Now, if you want to answer the question as to if your mobile traffic is up or not… You would go to the Overview report (in the same section, Audience, as your Benchmarking report). You'll see a blue circle with All Sessions on top of the report. Click that. A new pane will open up. In the search box type in Mobile. You'll see a couple segments. Choose Mobile plus Tablet. Click Apply. This is your overall traffic and your mobile traffic. You should see a rising trend here (if your business is doing well).
In summary: Benchmarking shows how you are doing vs. Competition. Your Overview report shows a long term mobile traffic trend (just change the date range on top right).
I hope this helps. If you have any other questions, please do reply!
Avinash.